> For the complete documentation index, see [llms.txt](https://captivatehelp.newbluelive.com/llms.txt). Markdown versions of documentation pages are available by appending `.md` to page URLs; this page is available as [Markdown](https://captivatehelp.newbluelive.com/troubleshooting/use-the-audio-visualizer.md).
# Use the Audio Visualizer
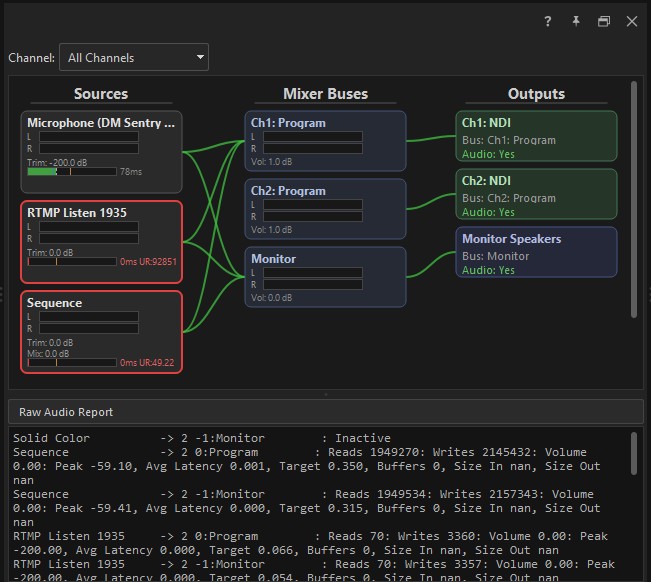
The Audio Visualizer is a diagnostic panel that draws every audio source, every mixer bus, and every output in your show in one picture, with the live signal flowing through each connection. It answers questions like **why is there no audio on air?**, **why is there echo?**, **why does the audio sound glitchy?**, and **why does one source sit at a different level from the rest?**
## Where to open it
Open the View menu and choose **Audio Visualizer**. The panel appears as a tab next to the Message Log; drag the tab out for a floating window.
## What it shows
Three columns connected by curved lines.
**Sources** (left) lists every live audio source — microphones, NDI feeds, capture devices, Zoom callers, video clips with audio. Each source shows its name, L and R meter bars with a dB readout, input trim and mix levels in dB when set, and a latency bar that tracks how much audio is in the buffer queue.
**Mixer Buses** (center) lists every bus the channel routes through — Program, Monitor, Zoom, ISO, Stream, SRT. Each bus shows its master level, L/R meters, and mute state.
**Outputs** (right) lists every output device — Display, NDI, SDI, recording, streaming — paired with the bus that feeds it.
**Connection lines** between the columns tell you the routing at a glance:
* Solid colored line: the source is feeding that bus. Color tracks level — green below -12 dB, yellow between -12 dB and -3 dB, red above -3 dB.
* Dashed red line with an X: the source is excluded from that bus (a mix-minus). This is normal for Zoom audio routed away from the Zoom bus.
* Dashed dim line into an output: that output doesn’t carry audio.
A **Channel** selector at the top filters to one channel or shows all. In an all-channels view, buses are labeled `Ch1: Program`, `Ch2: Program`, and so on; the Monitor bus is global and shown once.
Below the diagram, the **Raw Audio Report** button expands a text-only diagnostic dump with per-instance buffer counts, underrun and overrun seconds, and the watermarks tracked since the panel opened. Both views refresh continuously while the panel is open.
## How to read it for common problems
**No audio on air.** Look for a source with green meters whose line to the Program bus is dashed-red — that source is muted on Program. Check the Program bus for its own mute indicator. If Program shows level but no output column has a solid line in, no output is routed to Program.
**Echo or feedback in Zoom.** Trace the connection from any non-Zoom source to the Zoom bus. It should be dashed-red. A solid line into the Zoom bus from a microphone or Program source is the echo path — fix it in the Zoom integration’s mix-minus settings.
**Clipping.** Watch for source meters in the red. A red border with a non-zero error count means the buffer is also overrunning. Lower the trim on the source, not the mix level on the bus.
**One source quieter than the rest.** Compare the Trim and Mix readouts across sources. Two sources at the same on-air loudness will have similar trims; a -20 dB trim against a 0 dB trim is a misconfigured input.
**Glitches or dropouts.** Watch the latency bar under each source. If the filled bar runs well past the dashed target marker, or far short of it, the source is drifting against the mixer clock. The bar turns yellow as drift grows and red when it’s critical. A single source in red while everyone else stays green points at that source’s driver or network.
## Related
* [The Audio Mixer](/set-up-your-production/chapter-index-5/the-audio-mixer.md) — set trims, mix levels, and per-source mute. The Audio Visualizer reads what the mixer is doing; the mixer is where you change it.
* [Report a problem with a support package](/troubleshooting/report-a-problem-with-a-support-package.md) — when an audio issue isn’t obvious from the visualizer, the support package captures the same diagnostic data for the support team.
---
# Agent Instructions
This documentation is published with GitBook. GitBook is the documentation platform designed so that both humans and AI agents can read, navigate, and reason over technical content effectively. Learn more at gitbook.com.
## Querying This Documentation
If you need additional information that is not directly available in this page, you can query the documentation dynamically by asking a question.
Perform an HTTP GET request on the current page URL with the `ask` query parameter, and the optional `goal` query parameter:
```
GET https://captivatehelp.newbluelive.com/troubleshooting/use-the-audio-visualizer.md?ask=&goal=
```
`ask` is the immediate question: it should be specific, self-contained, and written in natural language.
`goal` is optional and describes the broader end goal you are ultimately trying to accomplish on behalf of the user. GitBook uses it to tailor the answer towards what is most useful for that goal.
The response will contain a direct answer to the question and relevant excerpts and sources from the documentation.
Use this mechanism when the answer is not explicitly present in the current page, you need clarification or additional context, or you want to retrieve related documentation sections.