> For the complete documentation index, see [llms.txt](https://captivatehelp.newbluelive.com/llms.txt). Markdown versions of documentation pages are available by appending `.md` to page URLs; this page is available as [Markdown](https://captivatehelp.newbluelive.com/play-and-update-graphics/chapter-index/5-drive-with-data-controller.md).
# 5. Drive a graphic with a Data Controller
By the end of this step, you’ll understand how to add a Data Controller to a graphic and let it update on-air content from a live source, such as a scoreboard system, weather service, presentation app, or Zoom meeting.
The Data Controller handles the source connection: it knows where the data comes from, how to read updates, and which fields can control the graphic’s values. Some controllers also handle sign-in or device setup.
## When to choose this step
Pick a Data Controller when:
* Another system is producing the data: a scoreboard, a sports stats system, a weather feed, a presentation platform, a video conference.
* You want Captivate to read updates directly from that system instead of from a file you maintain.
* Captivate includes a controller designed for that source, often with matching graphics.
If you maintain the data yourself in a spreadsheet, CSV file, Google Sheet, XML file, or JSON file, use Tables ([step 4](/play-and-update-graphics/chapter-index/4-drive-from-spreadsheet.md)). If the source isn’t in the catalog, either build your own ([step 6](/play-and-update-graphics/chapter-index/6-write-your-own-controller.md)) or shape the data into a Table.
## Basic setup
The setup details vary by controller, but most Data Controllers follow the same basic steps. The specifics (sign-in, configuration options, field mappings) live in each Data Controller’s page.
1. Drag the matching graphic from the **Library** into the **Project List**. Many Data Controllers include or work best with matching graphics, so the source fields and graphic values already line up: a basketball scoreboard graphic for a basketball scoreboard controller, a weather card for the weather controller.
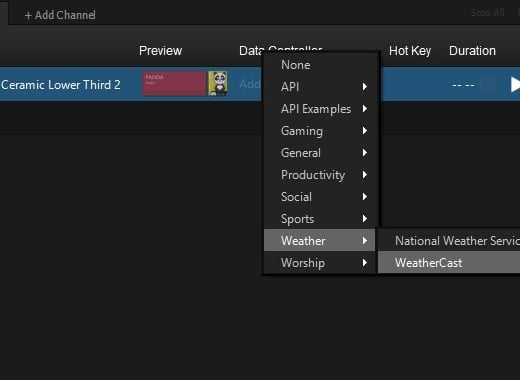
2. In the **Project List**, find the **Data Controller** column and pick the Data Controller that matches your source (for example **Sports → Scoreboard Tool**, **Weather → WeatherCast**, or **Worship → ProPresenter**). Pick **New Input** to create a fresh instance.
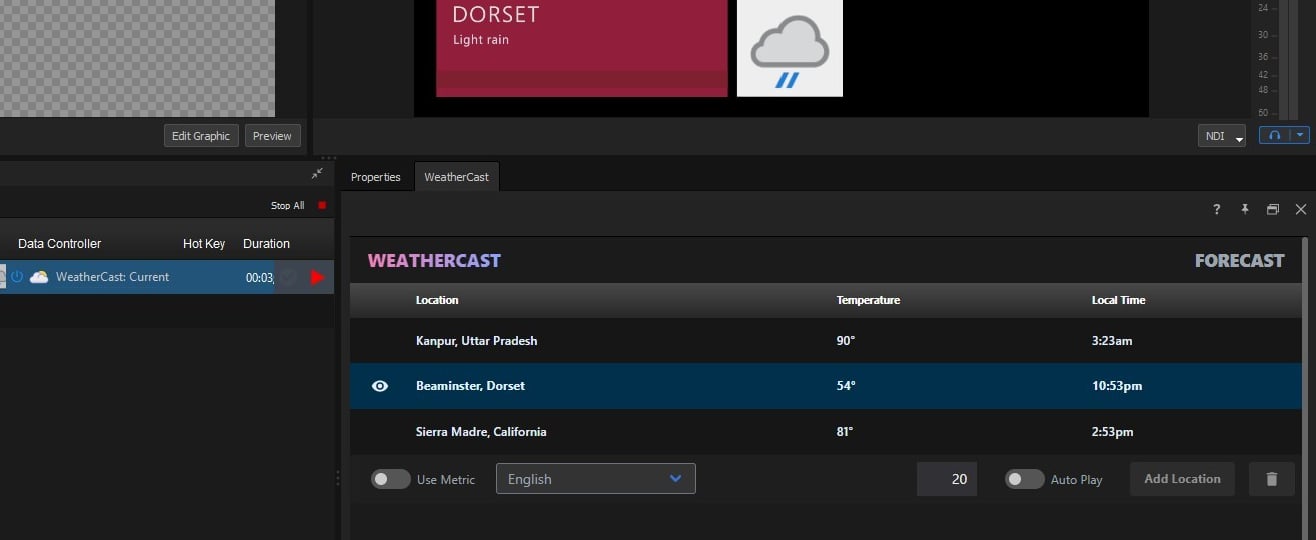
3. The Data Controller’s panel opens with its own setup: sign in if required, pick a feed, choose a game, select a device, enter a location. Each controller’s page explains its exact setup flow. If Captivate asks you to authenticate an online account, follow the prompt or see [Authenticate your Internet Accounts](/play-and-update-graphics/chapter-index-3/authenticate-your-internet-accounts.md).
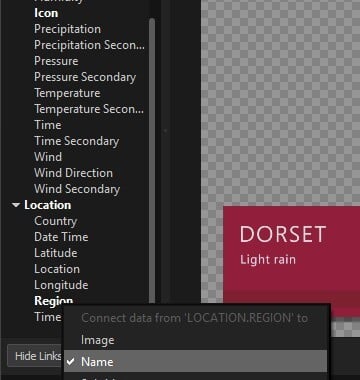
4. Captivate connects matching controller fields to matching graphic values when it can. To change or add connections, click **Link Data** in the **Preview** panel and connect the source fields to the graphic values they should control.
5. Play the graphic on. As the source changes (a basket is scored, the clock ticks, the song changes in ProPresenter, a participant in Zoom is renamed), the on-air graphic updates, with animations if the designer set them up.
## Common Data Controllers
The Data Controller catalog lists the Data Controllers included with Captivate, with one page for each source. A few that anchor the common workflows:
* [Scoreboard Tool](/play-and-update-graphics/chapter-index-3/scoreboard-tool-overview.md) — the built-in per-sport scoreboard Data Controller.
* [Scorebird](/play-and-update-graphics/chapter-index-3/connect-scorebird.md) — connect scoreboard data from a Scorebird NeST device.
* [Hardware scoreboard](/play-and-update-graphics/chapter-index-3/connect-a-hardware-scoreboard.md) (Daktronics All Sport and similar) — for venues where the scoreboard speaks serial directly.
* [Sportzcast](/play-and-update-graphics/chapter-index-3/connect-sportzcast.md) — connect a Sportzcast Scorebot.
* [StatCrew](/play-and-update-graphics/chapter-index-3/connect-statcrew.md) — drive stats-heavy graphics from StatCrew.
* [Weather (WeatherCast)](/play-and-update-graphics/chapter-index-3/weather-controller.md) — real-time, location-specific weather updates.
* [ProPresenter](/play-and-update-graphics/chapter-index-3/connect-propresenter.md) and [EasyWorship](/play-and-update-graphics/chapter-index-3/connect-easyworship.md) — worship presentation integrations.
* [Zoom Manager](/play-and-update-graphics/chapter-index-3/connect-zoom-manager.md) and [Microsoft Teams](/play-and-update-graphics/chapter-index-3/connect-microsoft-teams.md) — meeting workflow integrations.
* [Social / Chat controller](/play-and-update-graphics/chapter-index-3/social-chat-controller.md) — chat overlays from supported platforms.
## Go deeper
Each Data Controller page walks you through that specific source: sign-in, the options it offers, which fields it produces, and the graphics it pairs with. Most Data Controllers follow similar basic setup steps, but the details belong on each controller’s page.
Open the [Data Controller catalog](/play-and-update-graphics/chapter-index-3.md) and choose the source you need.
## What you just did
You learned the basic steps for using a Data Controller: add a matching graphic, choose a controller in the **Data Controller** column, configure the source, check the connections with **Link Data**, and play the graphic. From here, use the controller-specific page for the source you need.
## Next step
[6. Write your own Data Controller](/play-and-update-graphics/chapter-index/6-write-your-own-controller.md): when the catalog doesn’t include your source and the data doesn’t fit a Tables workflow, use the Data Controller API to build a custom integration.
## Related
* [4. Drive a graphic from a spreadsheet or file](/play-and-update-graphics/chapter-index/4-drive-from-spreadsheet.md)
* [Data Controller catalog](/play-and-update-graphics/chapter-index-3.md)
* [Authenticate your Internet Accounts](/play-and-update-graphics/chapter-index-3/authenticate-your-internet-accounts.md)
* [6. Write your own Data Controller](/play-and-update-graphics/chapter-index/6-write-your-own-controller.md)
---
# Agent Instructions
This documentation is published with GitBook. GitBook is the documentation platform designed so that both humans and AI agents can read, navigate, and reason over technical content effectively. Learn more at gitbook.com.
## Querying This Documentation
If you need additional information that is not directly available in this page, you can query the documentation dynamically by asking a question.
Perform an HTTP GET request on the current page URL with the `ask` query parameter, and the optional `goal` query parameter:
```
GET https://captivatehelp.newbluelive.com/play-and-update-graphics/chapter-index/5-drive-with-data-controller.md?ask=&goal=
```
`ask` is the immediate question: it should be specific, self-contained, and written in natural language.
`goal` is optional and describes the broader end goal you are ultimately trying to accomplish on behalf of the user. GitBook uses it to tailor the answer towards what is most useful for that goal.
The response will contain a direct answer to the question and relevant excerpts and sources from the documentation.
Use this mechanism when the answer is not explicitly present in the current page, you need clarification or additional context, or you want to retrieve related documentation sections.