> For the complete documentation index, see [llms.txt](https://captivatehelp.newbluelive.com/llms.txt). Markdown versions of documentation pages are available by appending `.md` to page URLs; this page is available as [Markdown](https://captivatehelp.newbluelive.com/play-and-update-graphics/chapter-index/3-prepare-variations.md).
# 3. Prepare multiple variations
By the end of this step, you’ll be able to take a single graphic, such as a lower third or score card, and prepare several variations of it ahead of time. During the show, you can quickly switch to the version you need instead of editing values between every take.
The classic case: same lower third, five different speakers. Instead of cluttering your Project List with five copies of the same graphic, you keep one graphic with five rows of values. Same graphic, different values on screen each time.
## The mental model: rows are variations
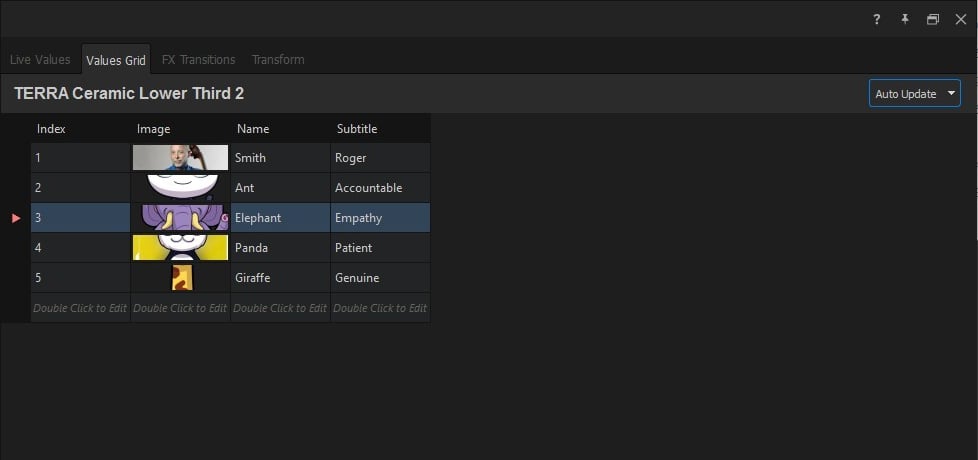
Where step 2’s **Live Values** tab showed you one set of values for the graphic, the **Values Grid** tab lets you prepare multiple rows of values:
* The far-left **Index** column identifies each row. Captivate adds it so every row has a number or key for quick recall.
* The remaining **columns** come from the graphic’s **Update Live** variables: **Name**, **Title**, **Color**, **Headshot**, or whatever the design exposes for live updates.
* **Rows** are variations: one row per speaker, one row per sponsor, one row per upcoming game.
You set up the rows once. During the show, select the row you need and send that variation to Program through the same graphic.
## Before you start
You should be comfortable with step 2: dragging a graphic into the Project List, finding the **Properties** panel, and editing values in the Live Values tab. The Values Grid is the next tab over.
## Stage a graphic
1. In the **Library**, find a graphic you want to use repeatedly with different content. A lower third is the canonical example, but anything with a clear set of variables works: a sponsor bug with a logo and tagline, an upcoming-segment slate with a title and time, or a player intro with name, number, and position.
2. Drag it into the **Project List** and select its row. The **Properties** panel updates for this graphic.
## Open the Values Grid tab
1. In the **Properties** panel, click the **Values Grid** tab. It sits next to **Live Values**.
2. A small spreadsheet appears. The far-left column is the **Index** column, which Captivate adds for quick row recall; the remaining columns come from the graphic’s Update Live variables. The exact columns depend on which variables the graphic was designed with. For the full column model and the Recall Keypad, see [Values Grid tab](/get-started/chapter-index-2/values-grid-tab-reference.md).
## Fill in your first few rows
1. In row 1, type the values for your first variation: **Name:** `Dana Marsh`, **Title:** `Producer`, **Accent:** your team blue. The **Preview** panel updates to match row 1 as you go.
2. To add a second row, right-click a row header at the left edge of the grid and choose **Insert Row Above**.
3. Fill row 2 with a second variation: **Name:** `Riley Chen`, **Title:** `Director`, and an accent color of your choice.
4. Keep going until you have a row per variation you expect to use. Five rows for five speakers, ten rows for a roster, or whatever the show needs.
**⚠️ WARNING**
**Import Data overwrites the grid.** The **Import Data** button replaces every existing row with the contents of the imported file. It can read CSV, XLSX, XML, or JSON, but there is no merge or append option. Save your project first if the grid already holds rows you want to keep.
## Select a row and play it on
1. Click row 1 in the Values Grid to select it. The **Preview** updates to show what row 1 will look like on air.
2. Click the graphic’s **Play** button in the **Project List**. The graphic plays on the **Program Monitor** using row 1’s values.
3. To change variations mid-show, select a different row in the Values Grid (row 2, for example). How the new row reaches Program depends on the update mode you saw in step 2: in **Auto Update** (the default), the change goes on air immediately, and animations defined by the graphic’s designer animate the swap (the name slides, the headshot crossfades). In **Manually Update**, the new row’s values show in the Preview first; send them to Program with the update buttons — without or with the update animation.
## Edit a row while it’s on air
The Values Grid stays editable while the graphic is on air, and the update mode controls when edits reach Program. With row 2 playing on the Program Monitor:
1. Click into row 2’s **Title** cell and type a correction: **Director** becomes **Producer-Director**.
2. In **Auto Update**, the on-air graphic updates immediately, with whatever animation the designer set up for that variable. In **Manually Update**, check the change in the Preview, then send it with the update buttons.
3. The row’s values persist, so the next time you select row 2 the corrected title comes back.
This is the same live-update behavior you saw in step 2, applied to whichever row is currently driving the on-air graphic.
## When to use step 3 vs step 4
Use the Values Grid when:
* The variations are known ahead of the show (a published lineup of speakers, a fixed sponsor list, a confirmed roster).
* You’ll edit them by hand if anything changes.
* You want them stored with the project file.
If the variations come from a spreadsheet, CSV file, Google Sheet, XML file, or JSON file that you maintain elsewhere (a Google Sheet your team updates, a CSV the stats crew exports), use the Tables controller instead. That’s [step 4](/play-and-update-graphics/chapter-index/4-drive-from-spreadsheet.md).
## What you just did
You set up multiple variations of one graphic in the **Values Grid** tab of the **Properties** panel, selected rows during playback, and edited row values live. One Project List graphic now does the work of several separate graphic rows, and your show stays tidy.
## Next step
[4. Drive a graphic from a spreadsheet or file](/play-and-update-graphics/chapter-index/4-drive-from-spreadsheet.md): point the same kind of variation list at an external CSV, Excel, Google Sheets, XML, or JSON file so the show data lives where the rest of your team already updates it.
## Related
* [2. Customize a graphic’s values](/play-and-update-graphics/chapter-index/2-customize-its-values.md)
* [Values Grid tab](/get-started/chapter-index-2/values-grid-tab-reference.md)
* [Operate the Values Grid live](/control-your-show/chapter-index/values-grid.md)
---
# Agent Instructions
This documentation is published with GitBook. GitBook is the documentation platform designed so that both humans and AI agents can read, navigate, and reason over technical content effectively. Learn more at gitbook.com.
## Querying This Documentation
If you need additional information that is not directly available in this page, you can query the documentation dynamically by asking a question.
Perform an HTTP GET request on the current page URL with the `ask` query parameter, and the optional `goal` query parameter:
```
GET https://captivatehelp.newbluelive.com/play-and-update-graphics/chapter-index/3-prepare-variations.md?ask=&goal=
```
`ask` is the immediate question: it should be specific, self-contained, and written in natural language.
`goal` is optional and describes the broader end goal you are ultimately trying to accomplish on behalf of the user. GitBook uses it to tailor the answer towards what is most useful for that goal.
The response will contain a direct answer to the question and relevant excerpts and sources from the documentation.
Use this mechanism when the answer is not explicitly present in the current page, you need clarification or additional context, or you want to retrieve related documentation sections.