> For the complete documentation index, see [llms.txt](https://captivatehelp.newbluelive.com/llms.txt). Markdown versions of documentation pages are available by appending `.md` to page URLs; this page is available as [Markdown](https://captivatehelp.newbluelive.com/play-and-update-graphics/chapter-index/2-customize-its-values.md).
# 2. Customize a graphic's values
By the end of this step, you’ll be able to take a graphic from the Library, change what it shows, and play it live with your edits. You’ll also see how value changes can update a graphic while it is on air.
The graphics in the Library aren’t fixed designs; they’re templates with variables you control.
## The mental model: variables
A **variable** is a named field in a graphic that you can change — a piece of text, an image, a color, or a number. When a designer builds a graphic, they leave these fields open and give each one a name, such as **Name**, **Title**, **Team Color**, or **Logo**. A lower third might expose a Name, a Title, an accent color, and a logo image.
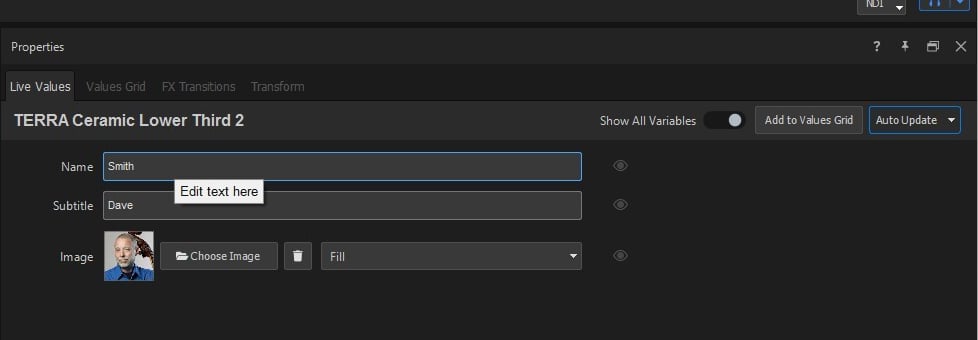
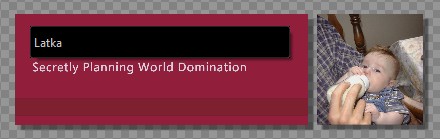
You don’t open the Designer to change a variable. The graphic’s variables appear as editable fields in the **Properties** panel, on its **Live Values** tab, and the **Preview** panel displays the graphic with whatever values you set, so you can watch each change as you make it. The same named fields can later be filled automatically by a Data Controller, which supplies values to the variables whose names match.
## Before you start
You should already know how to drag a graphic from the Library to the Project List and play it on. If not, walk through [1. Play a graphic](/play-and-update-graphics/chapter-index/1-play-a-graphic.md) first.
## Pick a graphic and stage it
1. In the **Library**, find a graphic with editable text. A lower third or a full-screen title is the easiest to start with.
2. Drag it from the Library into the **Project List**. Captivate adds the graphic to the show.
3. Click the graphic to select it. The **Properties** panel updates to show its properties.
## Open the Live Values tab
1. In the **Properties** panel, click the **Live Values** tab.
2. The Live Values tab lists the graphic values you can edit: text fields, image slots, color pickers, numeric values, dropdowns.
3. Scroll the list. The names come from the graphic design, so they’re usually descriptive: **Speaker Name**, **Lower Third Title**, **Team Color**, **Logo**.
## Edit a value and watch the Preview
1. Click into the first text field, for example **Speaker Name**. Type a new value.
2. As you edit, the **Preview** panel shows the change immediately. When the graphic is on air, the same change also updates the **Program Monitor**.
3. Try a few more fields. Change a color with the color picker; the Preview swaps it in. Drop a new image into an image slot; the Preview shows the new image in place.
**💡 TIP**
You can also edit text directly in the Preview. Click a text element in the Preview panel, type your change, and the matching value in the Live Values tab updates too.
## Play it live with your changes
1. Click the graphic’s **Play** button in the Project List. The graphic animates onto the **Program Monitor** with the values you’ve set. Your edits are now on air.
2. After the graphic is on air, the Program Monitor shows the live result. The Live Values tab stays available, so you can keep editing the graphic’s values.
## Edit values while the graphic is on air
You can keep editing Live Values while the graphic is on air. With the graphic still playing on the Program Monitor, return to the **Live Values** tab and change a value — type a new name, or pick a different color. As soon as you commit the change, the on-air graphic updates. If the designer set up animations for that value, the change animates rather than snapping — a name swap might fade and slide; a score might tick up.
Captivate uses the same behavior whether you type a value by hand or a Data Controller supplies it. If the graphic includes update animations, the value change can animate while the graphic stays on air.
### Auto Update and Manually Update
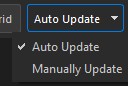
By default, a committed change goes on air immediately — **Auto Update**. The mode button above the values shows the current mode.
{% hint style="info" %}
**Manually Update** is available only in Captivate Broadcast. In other editions, the graphic is always on Auto Update.
{% endhint %}
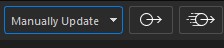
Switch the mode button to **Manually Update** when you want to stage a change and check it in the Preview before it reaches Program. Two buttons appear next to the mode button: one sends the values to Program without an update animation, the other sends them and plays the graphic’s update animation.
When you’re done editing, click the graphic’s red **Play** button to play it off. Your edits stay with the graphic; the next time you play it on, the same values come back.
## What you just did
You took a Library graphic, changed its values in the **Live Values** tab of the **Properties** panel, and played it live. You also saw how values can update while the graphic is on air. Next, you’ll set up **several variations** of the same graphic in advance, instead of editing a single graphic between every play.
## Next step
[3. Prepare multiple variations (Values Grid)](/play-and-update-graphics/chapter-index/3-prepare-variations.md): set up multiple variations of one graphic in a spreadsheet-style grid and switch between them during the show.
## Related
* [1. Play a graphic](/play-and-update-graphics/chapter-index/1-play-a-graphic.md)
* [Properties panel](/get-started/chapter-index-2/properties-panel.md)
* [Preview panel](/get-started/chapter-index-2/preview-panel.md)
---
# Agent Instructions
This documentation is published with GitBook. GitBook is the documentation platform designed so that both humans and AI agents can read, navigate, and reason over technical content effectively. Learn more at gitbook.com.
## Querying This Documentation
If you need additional information that is not directly available in this page, you can query the documentation dynamically by asking a question.
Perform an HTTP GET request on the current page URL with the `ask` query parameter, and the optional `goal` query parameter:
```
GET https://captivatehelp.newbluelive.com/play-and-update-graphics/chapter-index/2-customize-its-values.md?ask=&goal=
```
`ask` is the immediate question: it should be specific, self-contained, and written in natural language.
`goal` is optional and describes the broader end goal you are ultimately trying to accomplish on behalf of the user. GitBook uses it to tailor the answer towards what is most useful for that goal.
The response will contain a direct answer to the question and relevant excerpts and sources from the documentation.
Use this mechanism when the answer is not explicitly present in the current page, you need clarification or additional context, or you want to retrieve related documentation sections.