> For the complete documentation index, see [llms.txt](https://captivatehelp.newbluelive.com/llms.txt). Markdown versions of documentation pages are available by appending `.md` to page URLs; this page is available as [Markdown](https://captivatehelp.newbluelive.com/play-and-update-graphics/chapter-index-3/weather-controller.md).
# Connect weather updates with WeatherCast
Use WeatherCast to fill weather graphics automatically with real-time, location-specific data. Complete the steps in this article to connect the WeatherCast Data Controller to your graphics.
WeatherCast is included in Captivate Broadcast and available as an add-on for Captivate Sport.
* [Setting up Current Weather Display](#setting-up-current-weather-display)
* [Setting up a Multi-Day Forecast](#setting-up-a-multi-day-forecast)
* [Setting up a Multi-Hour Forecast](#setting-up-a-multi-hour-forecast)
* [Showcasing Multiple Locations](#showcasing-multiple-locations)
## Setting up Current Weather Display
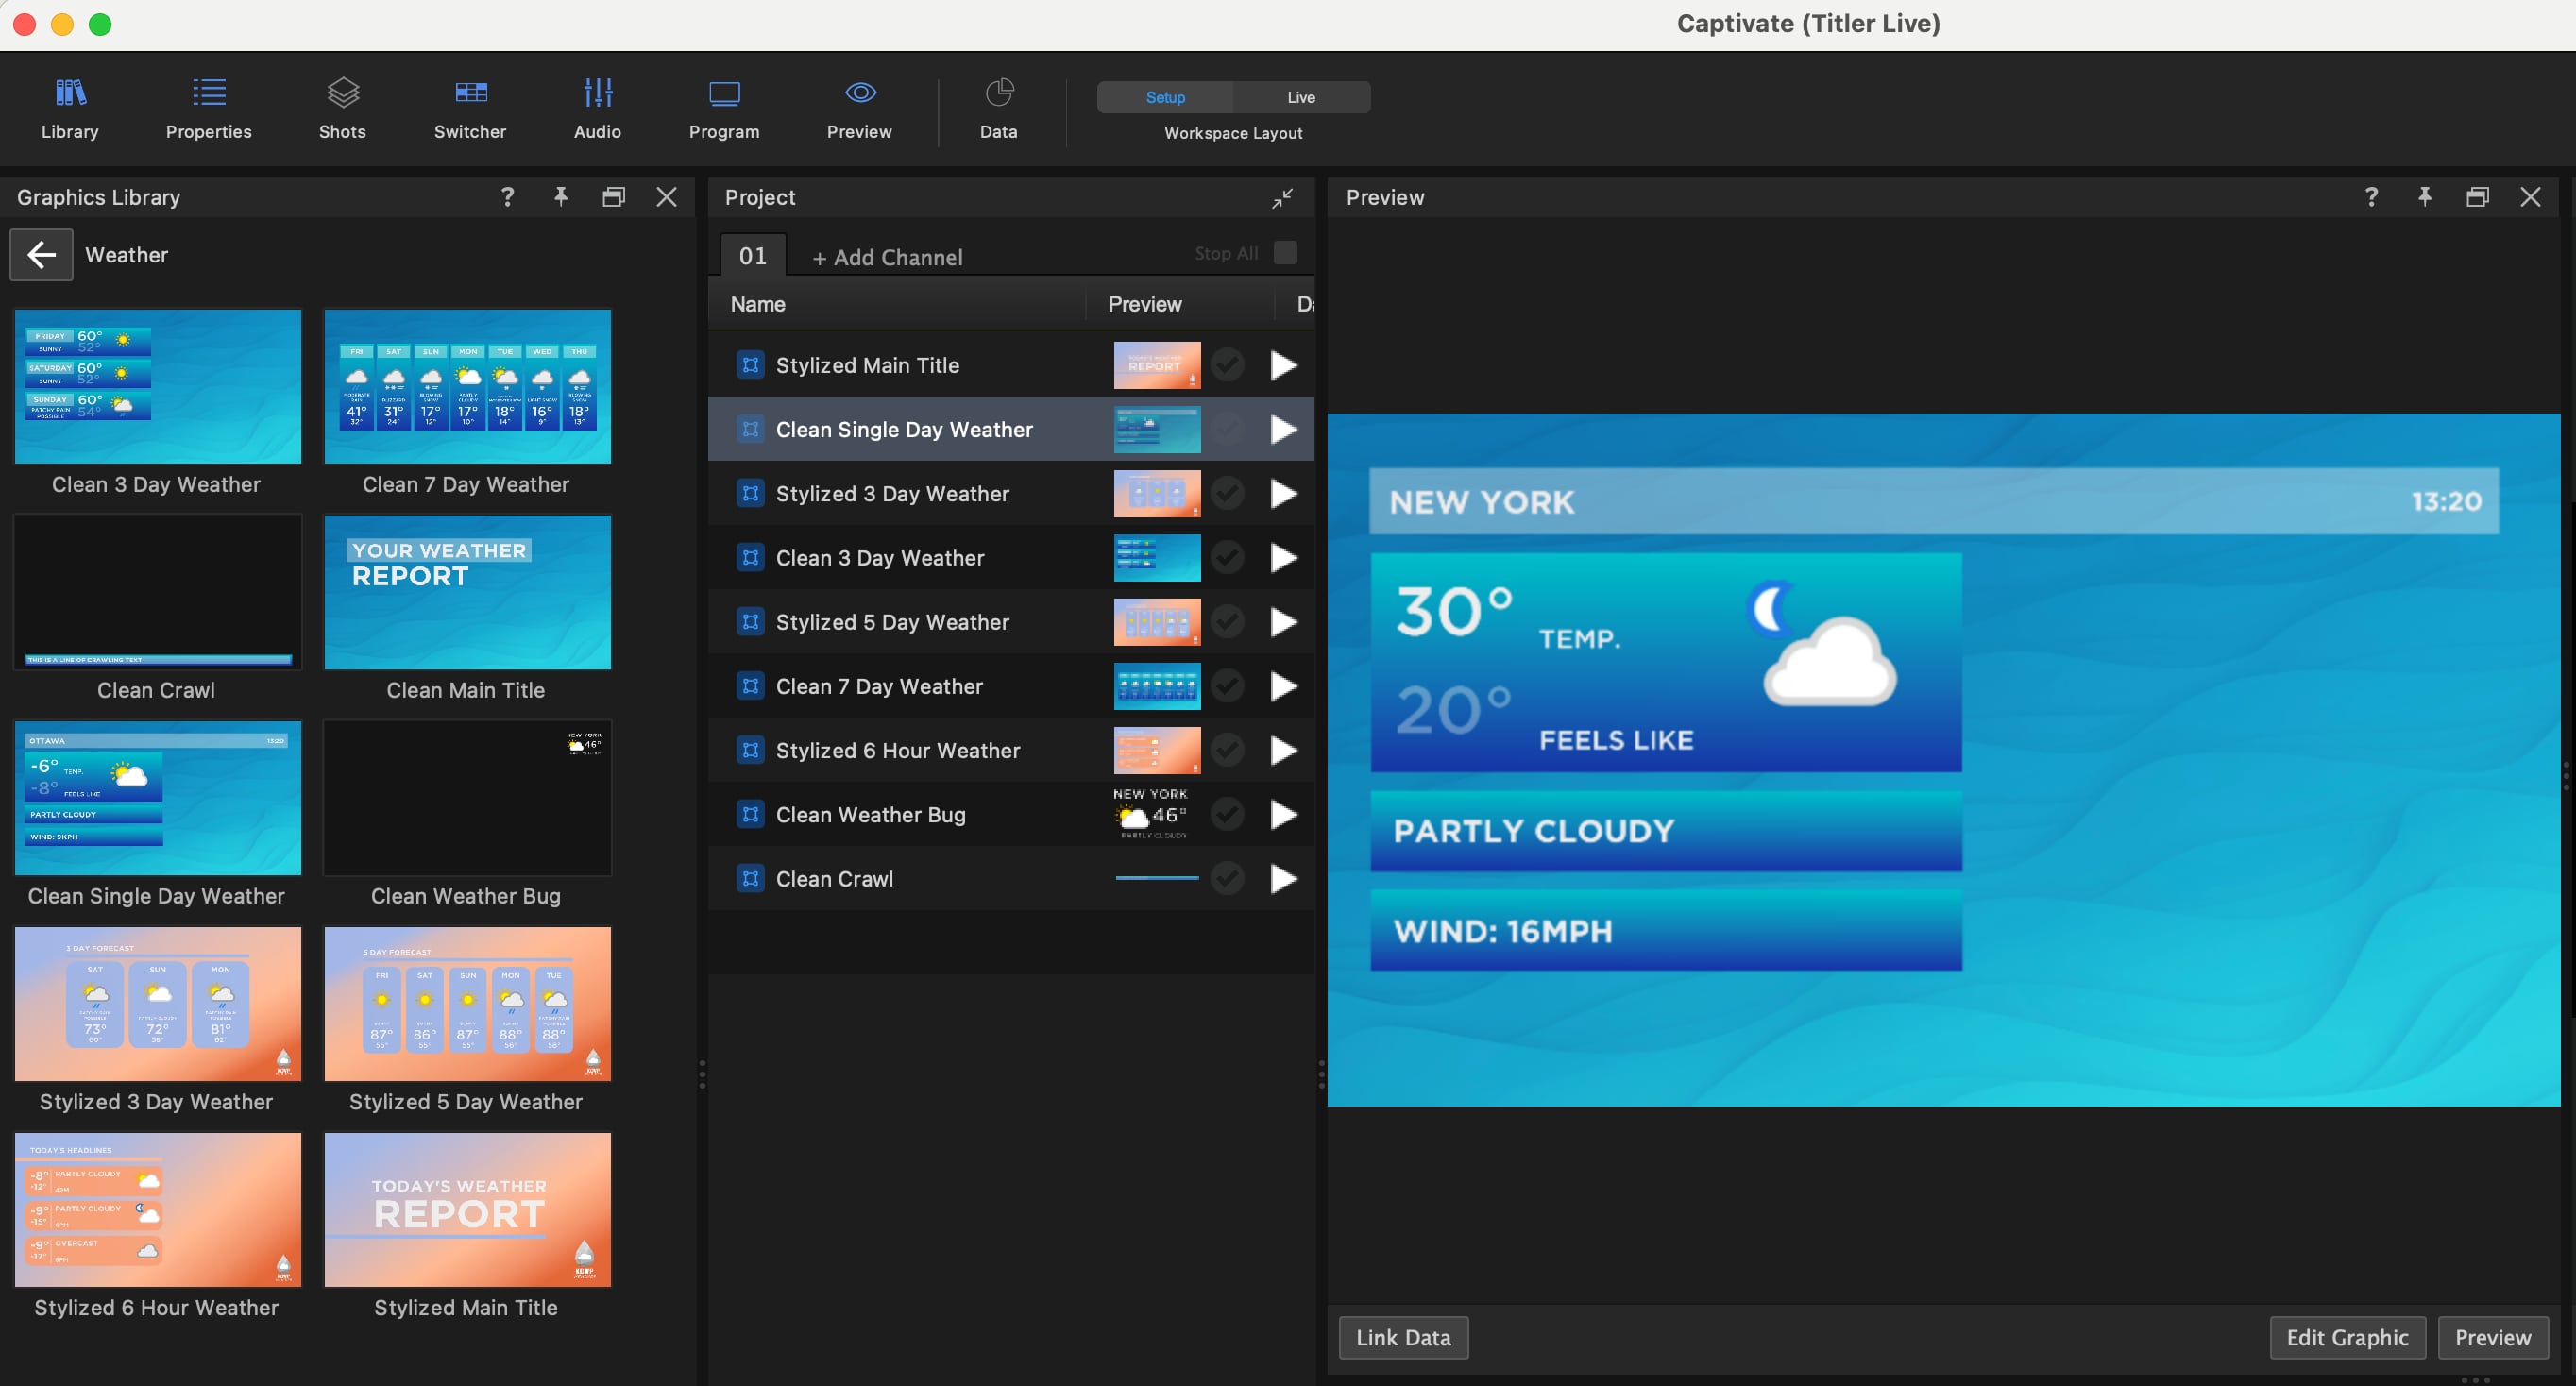
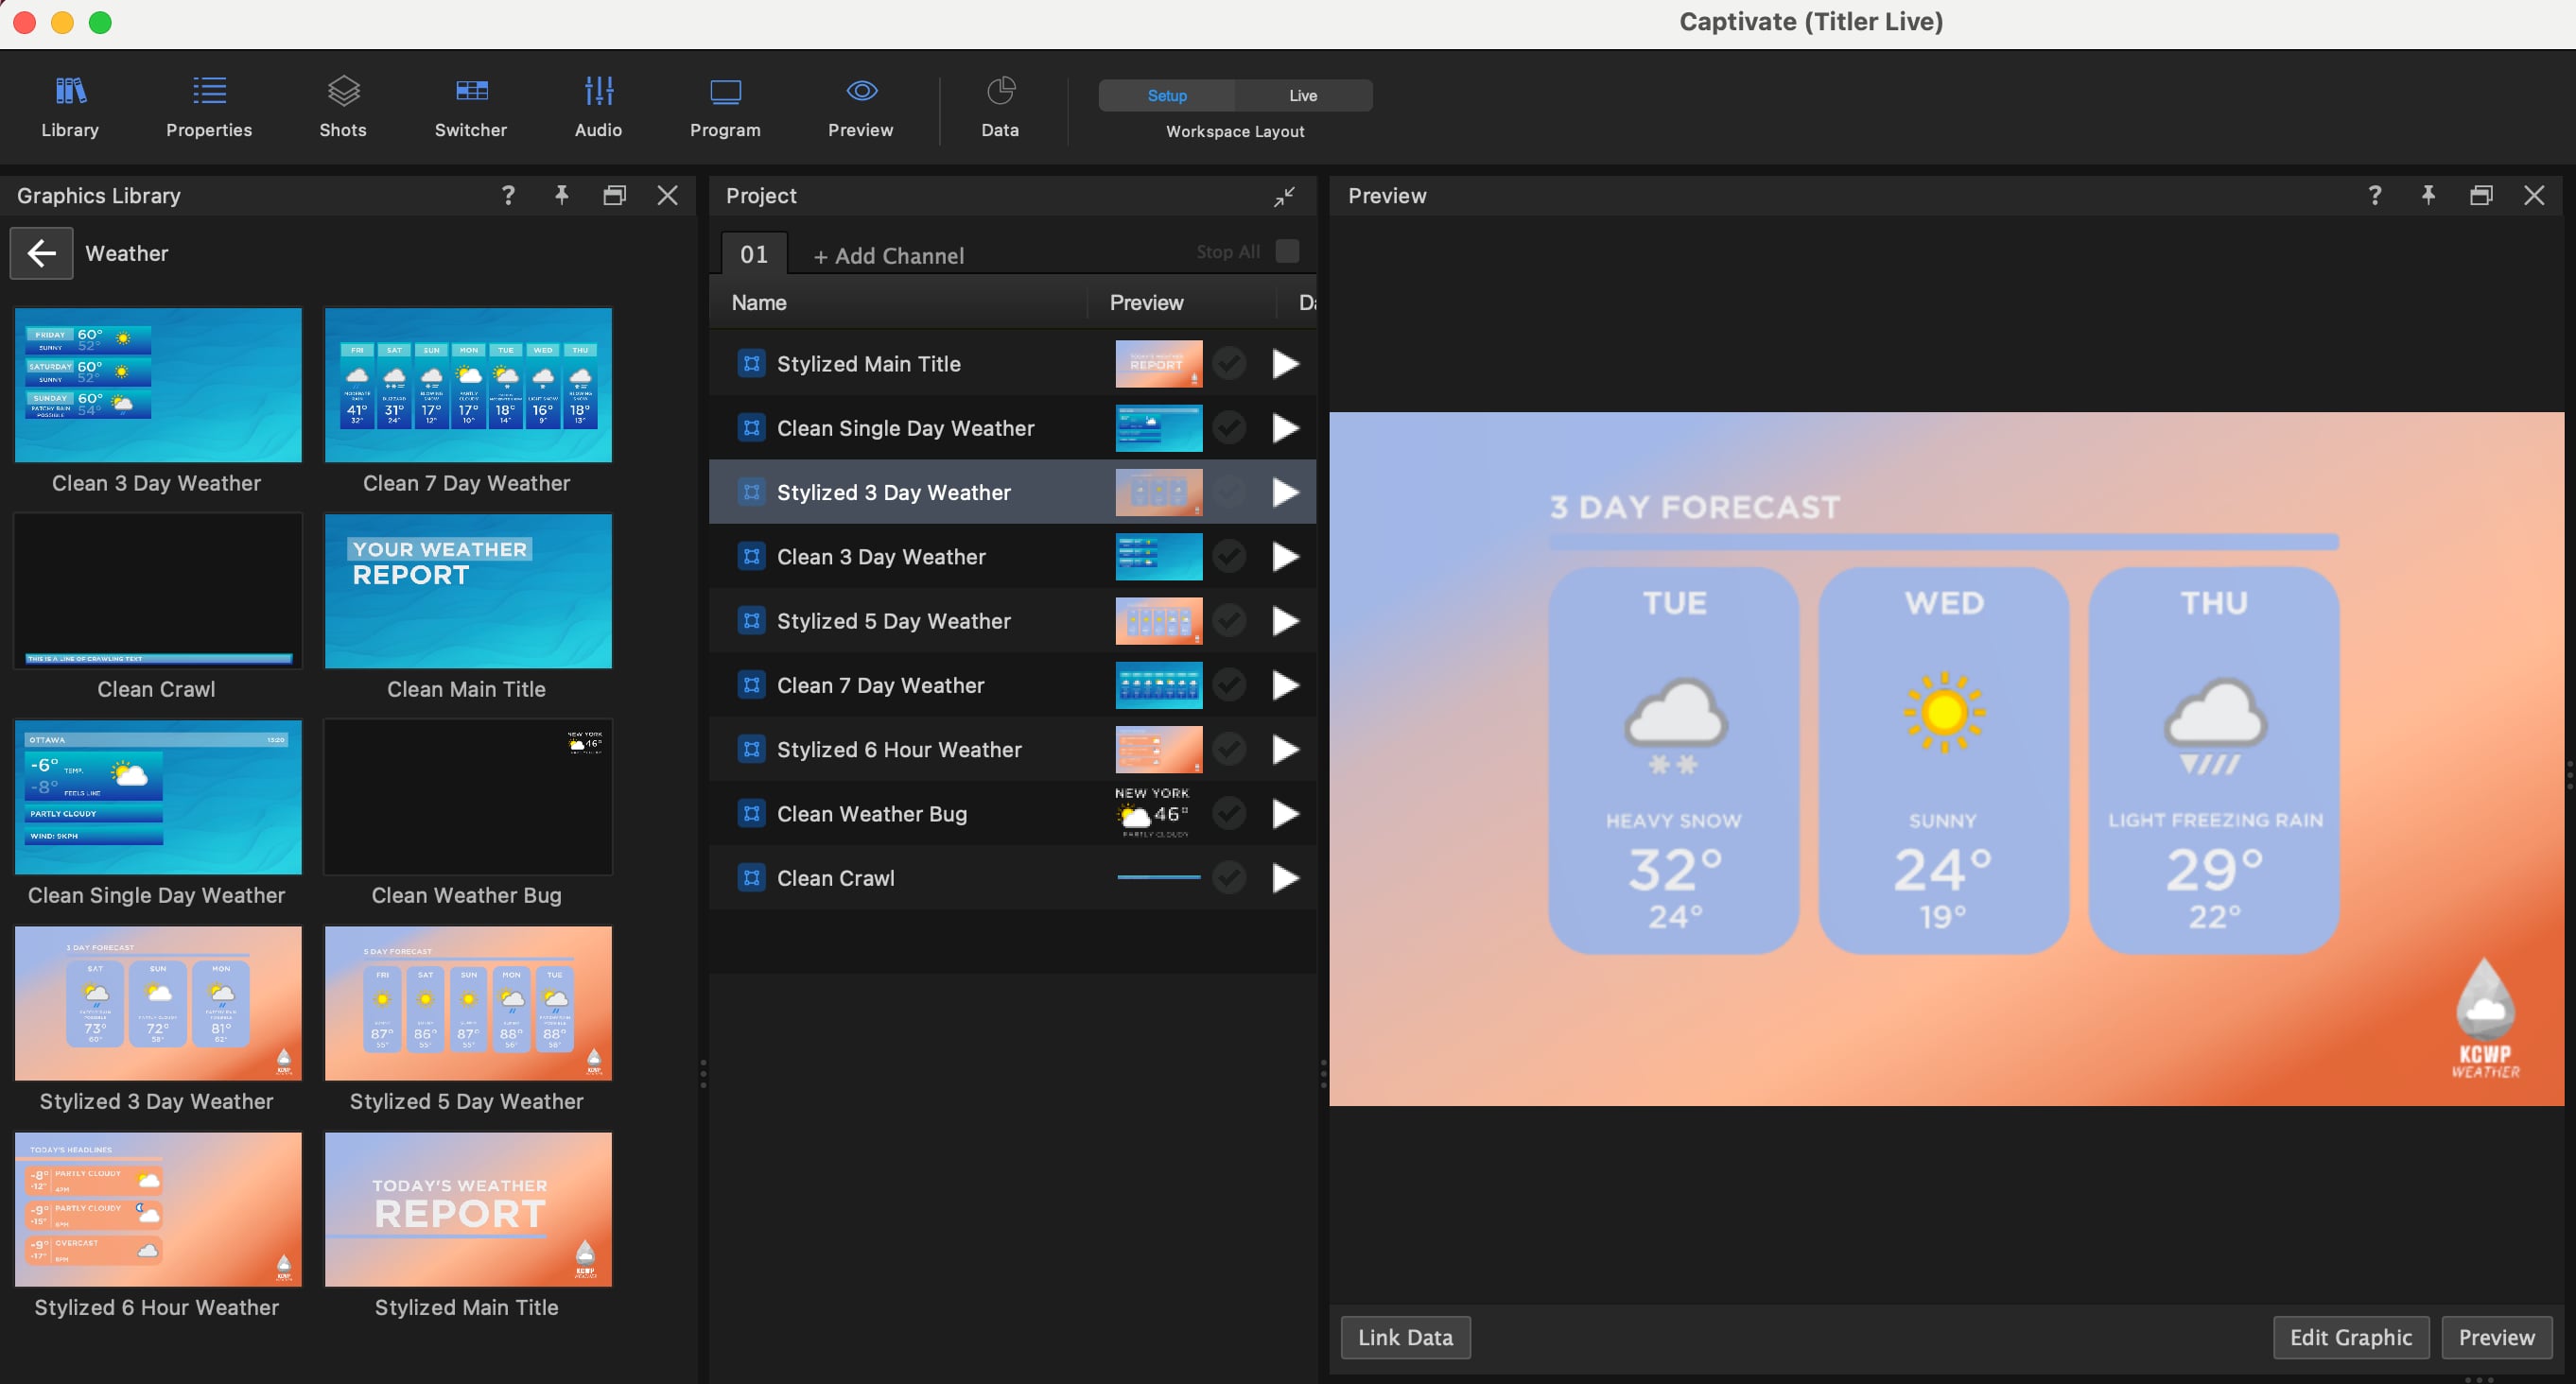
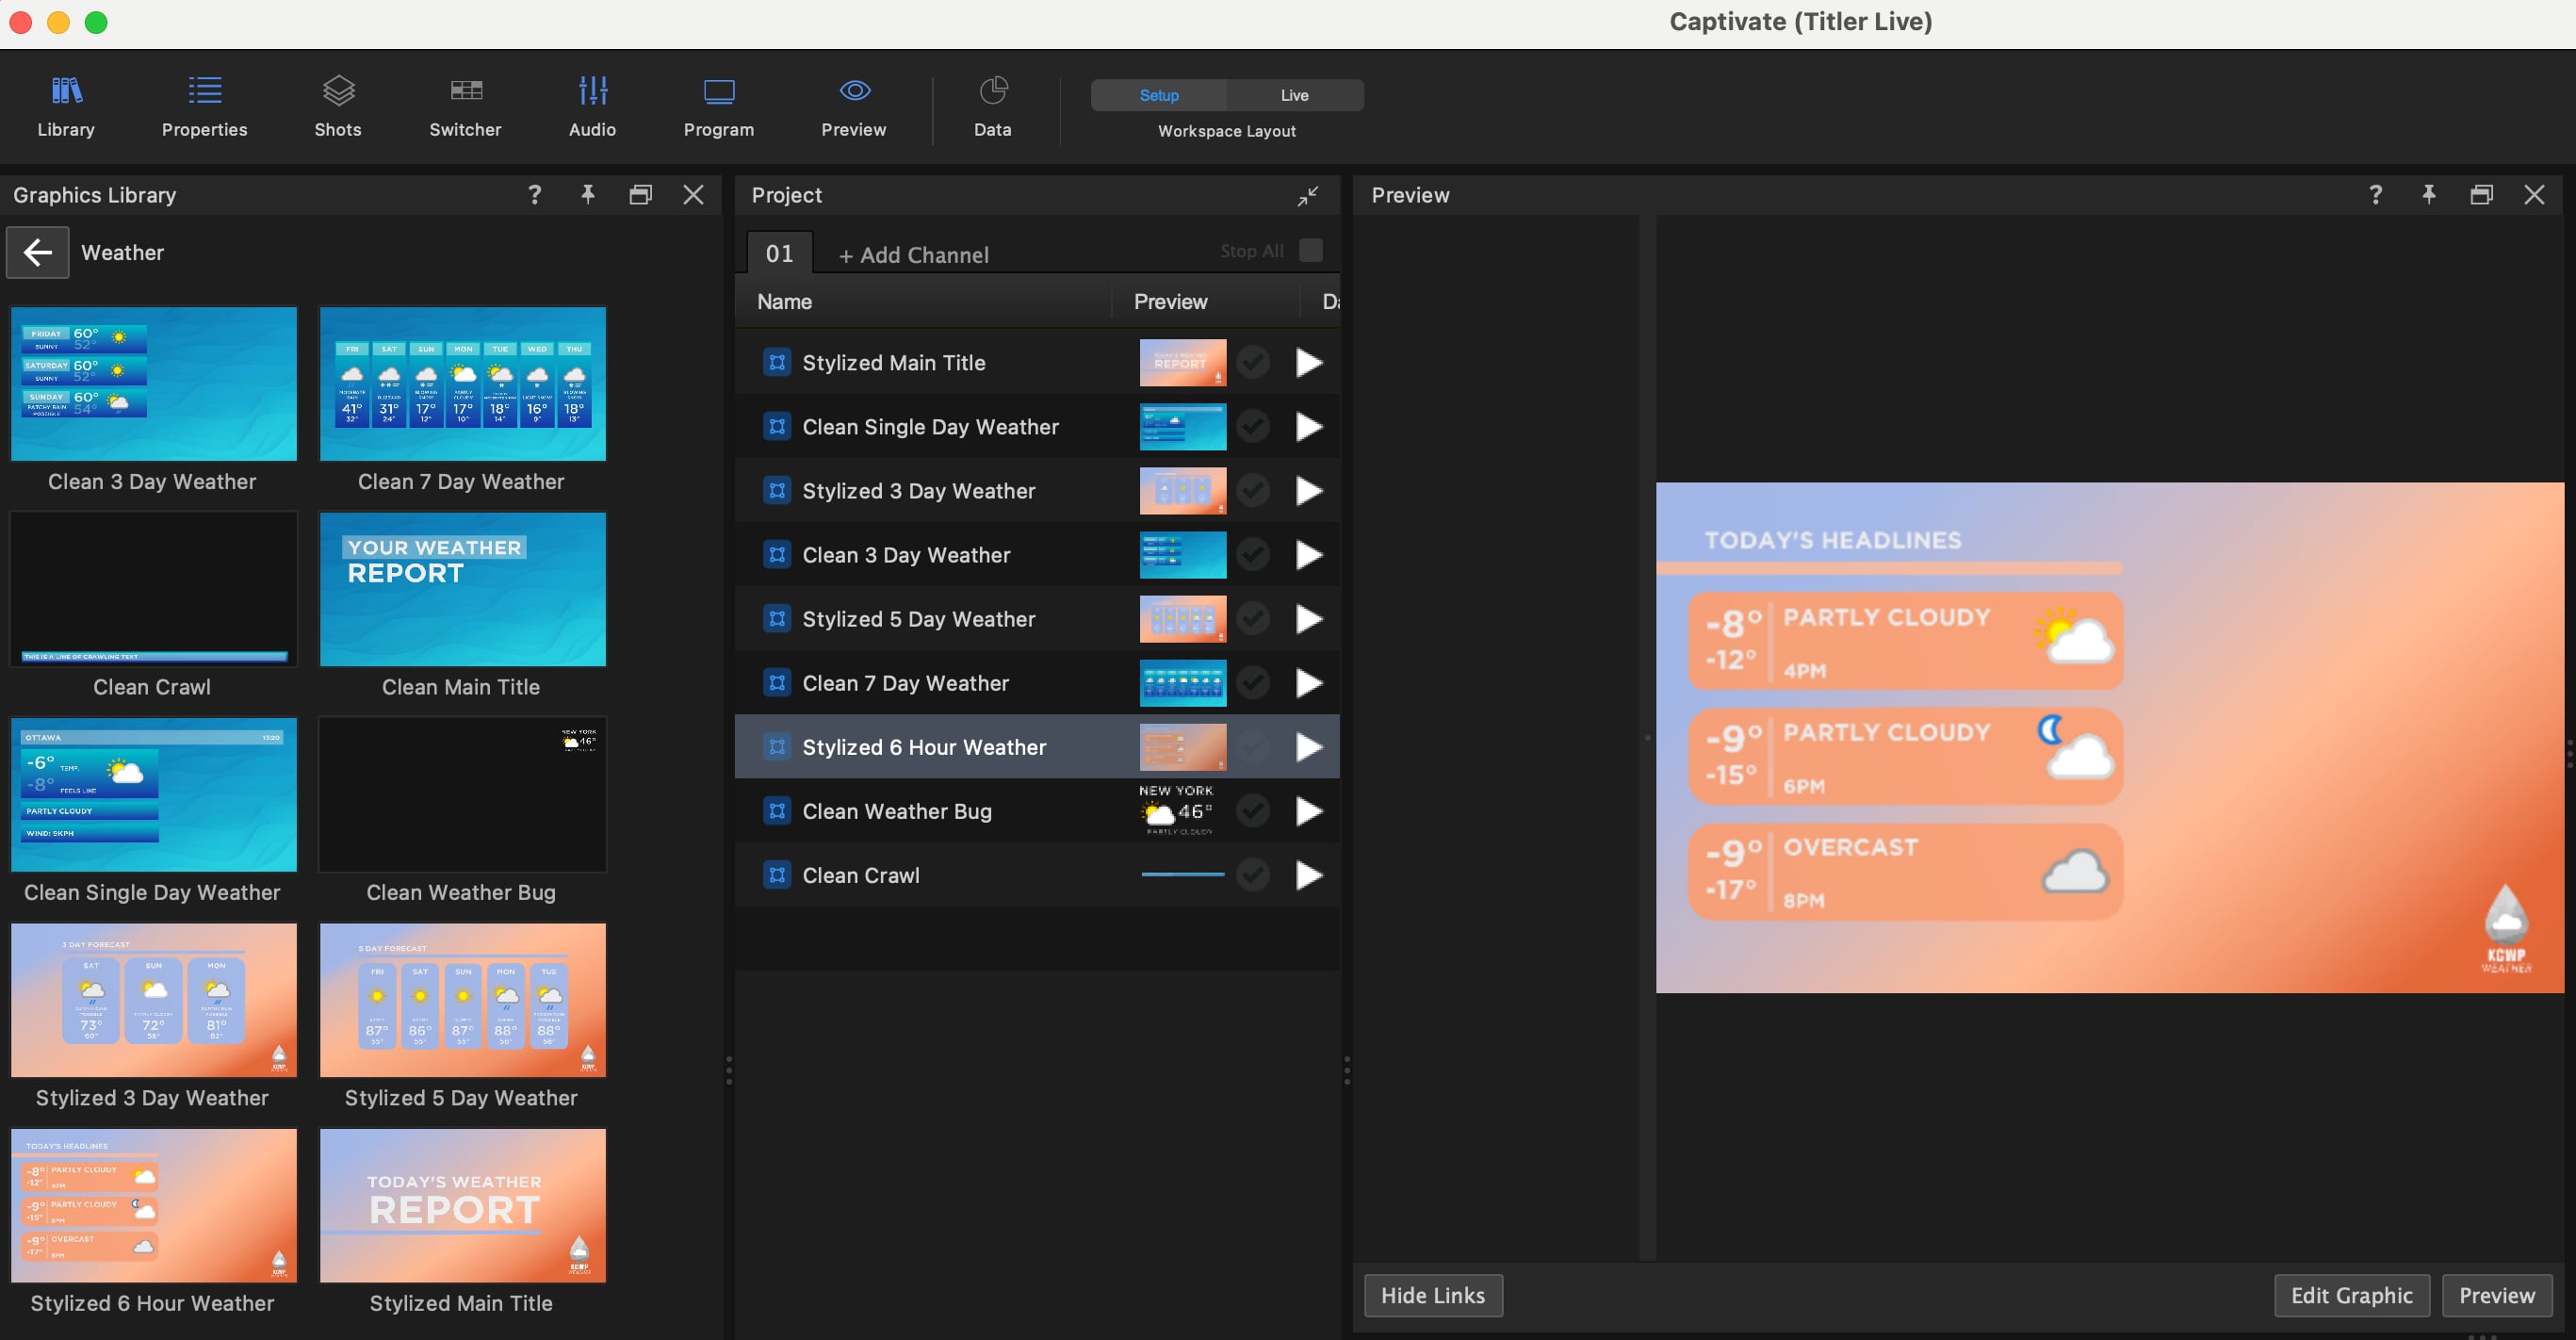
1. In Captivate’s [playout interface](/get-started/chapter-index-2/the-playout-interface.md), navigate to the Library > **Weather** to access all of our pre-made weather-themed graphic templates. Drag and drop a **Single Day** or **Weather Bug** graphic into your Project List and select to highlight.
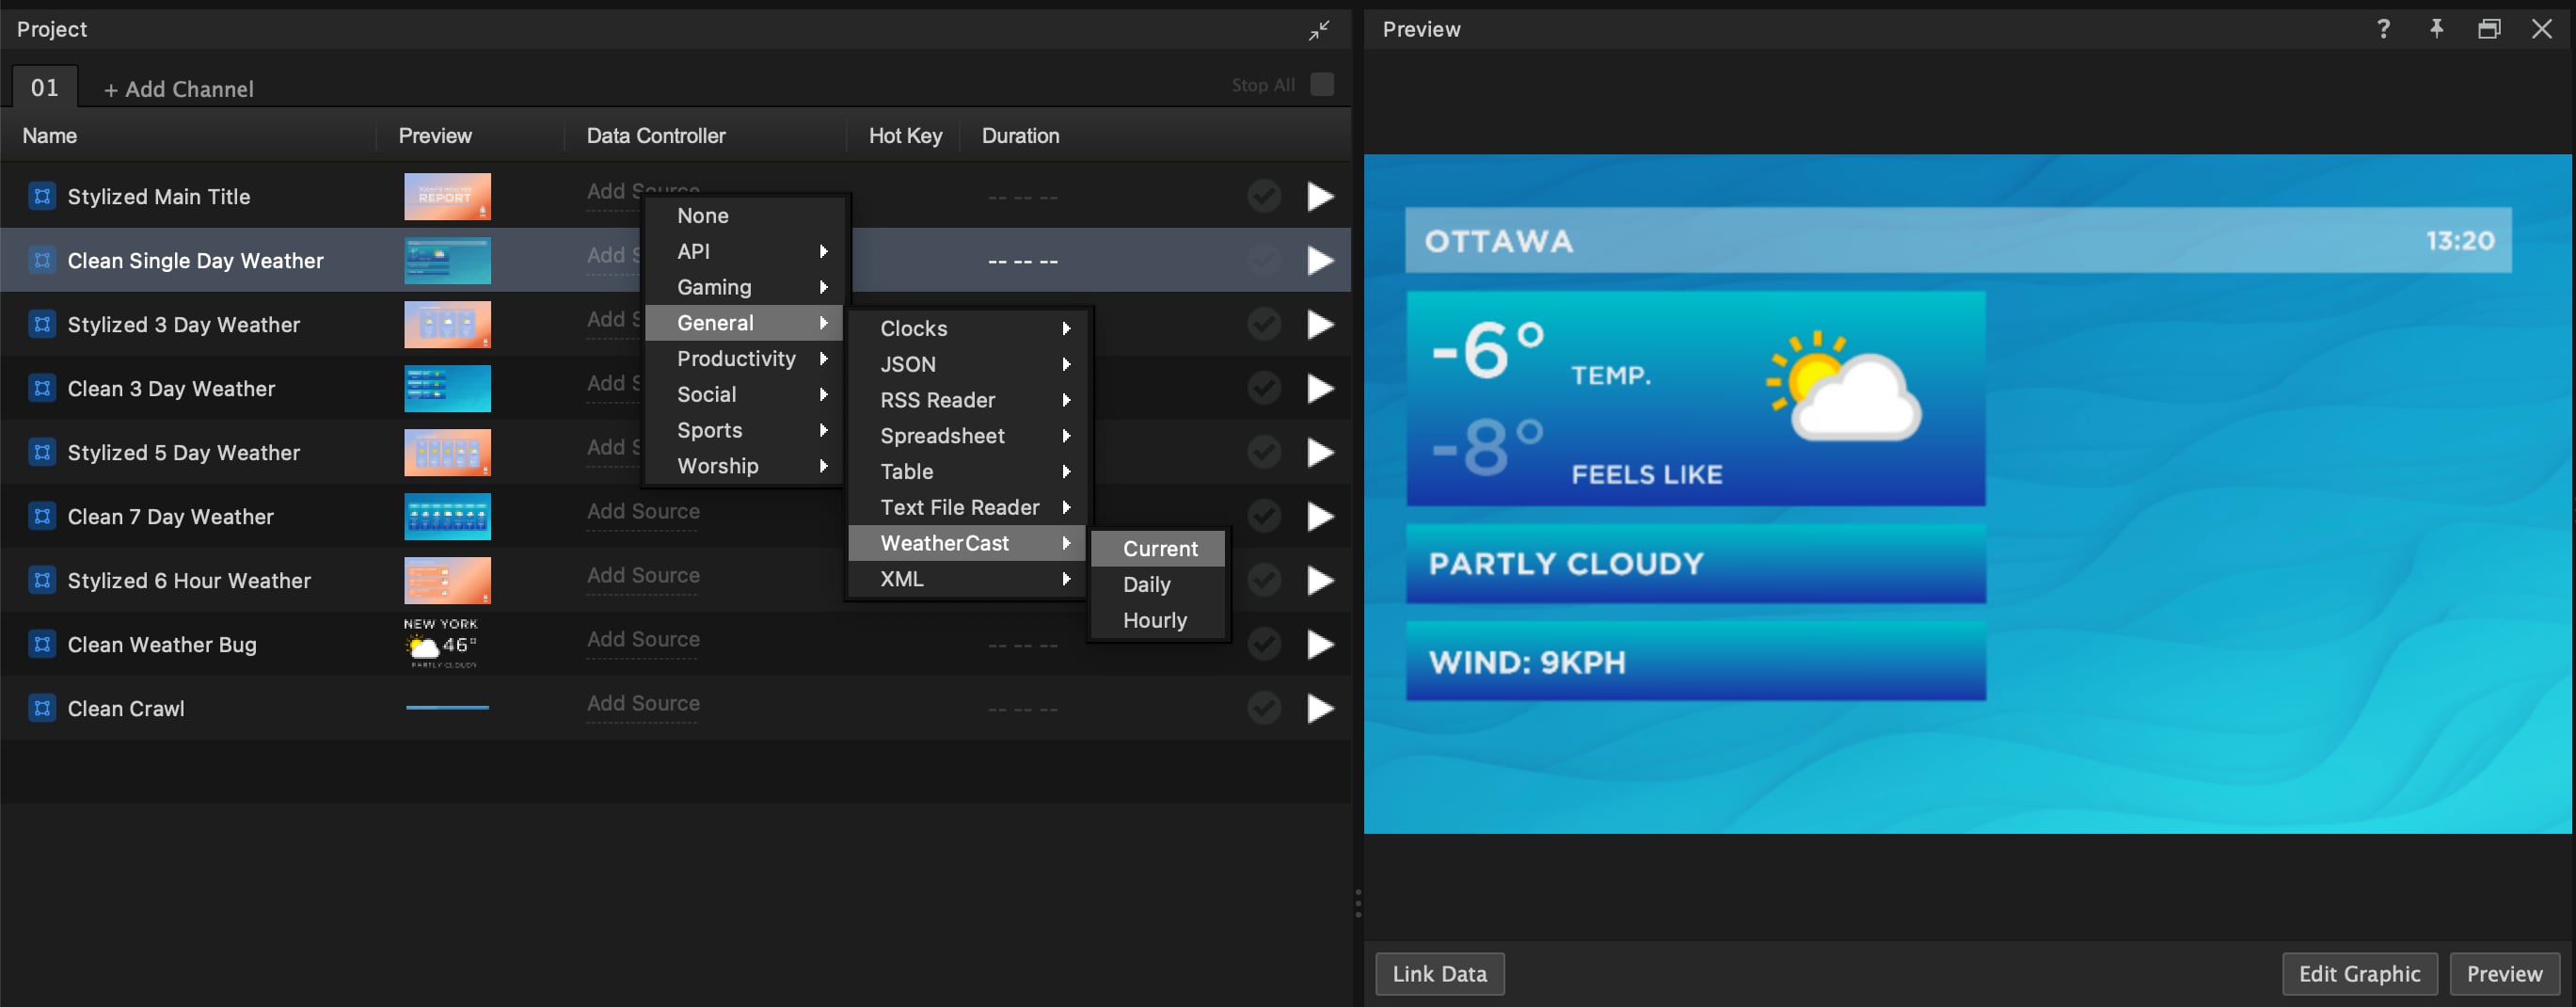
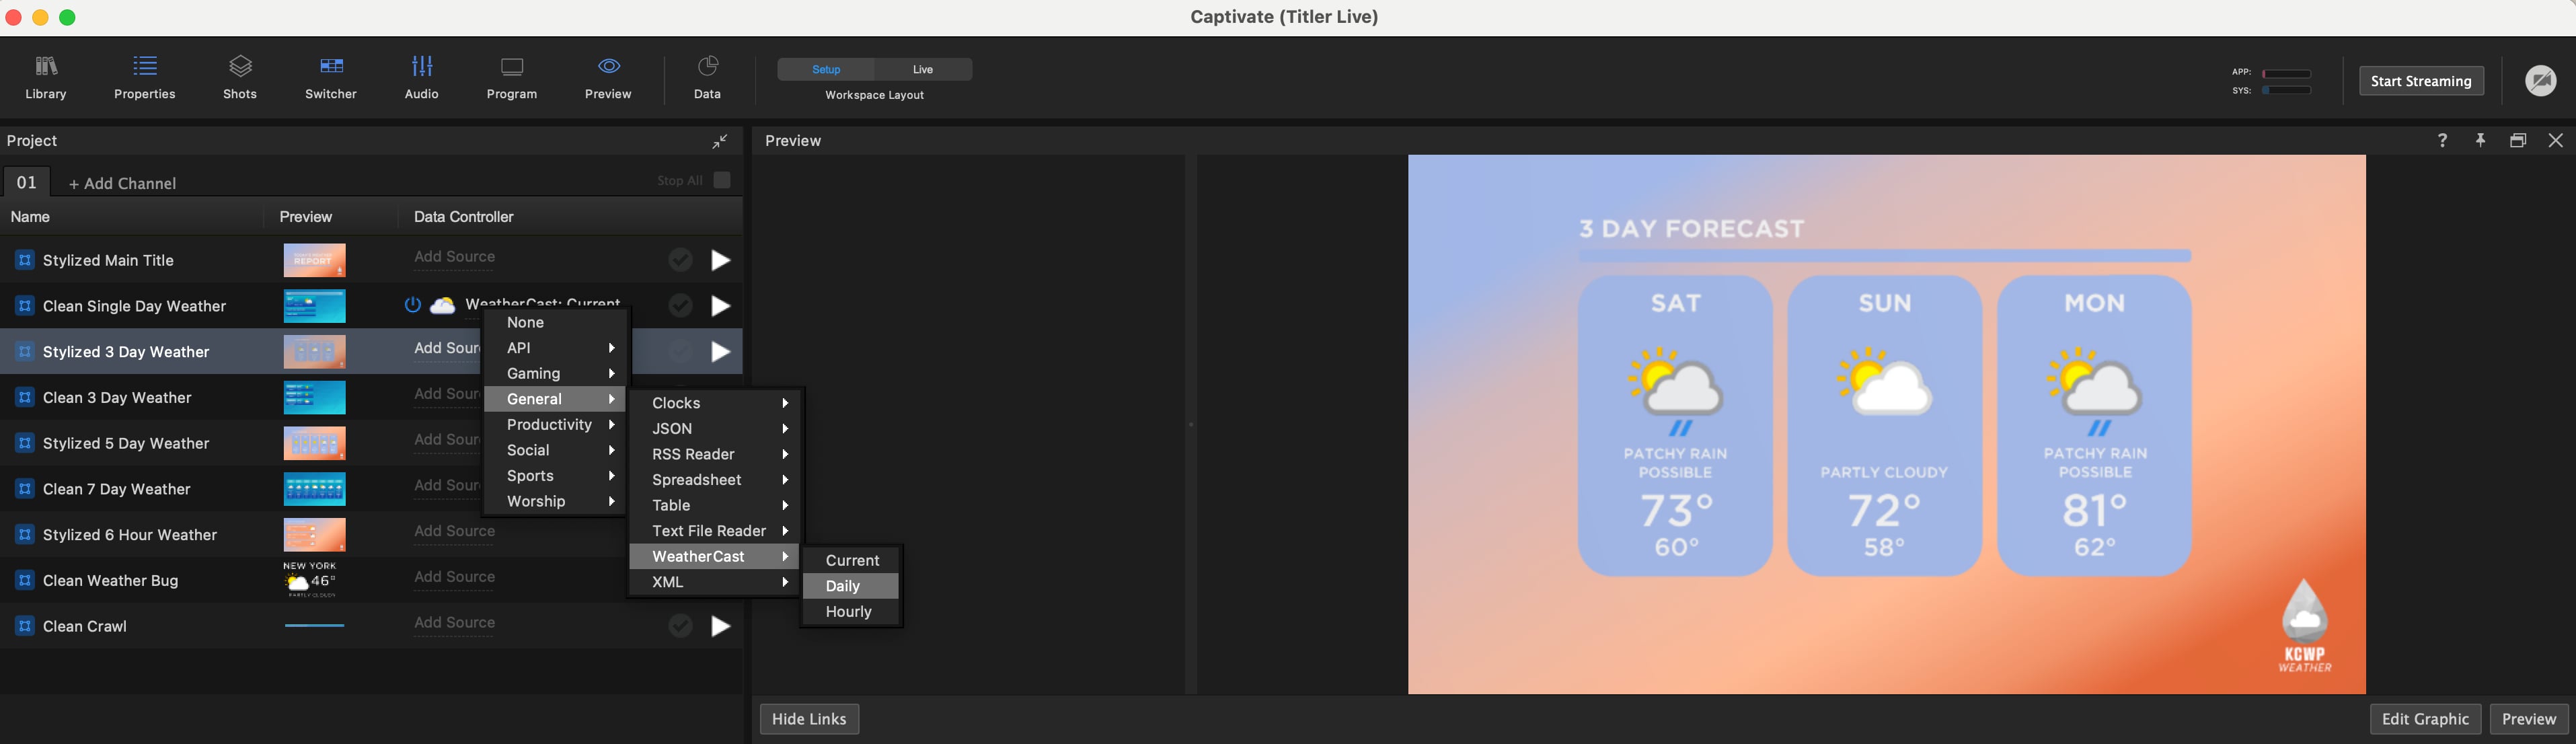
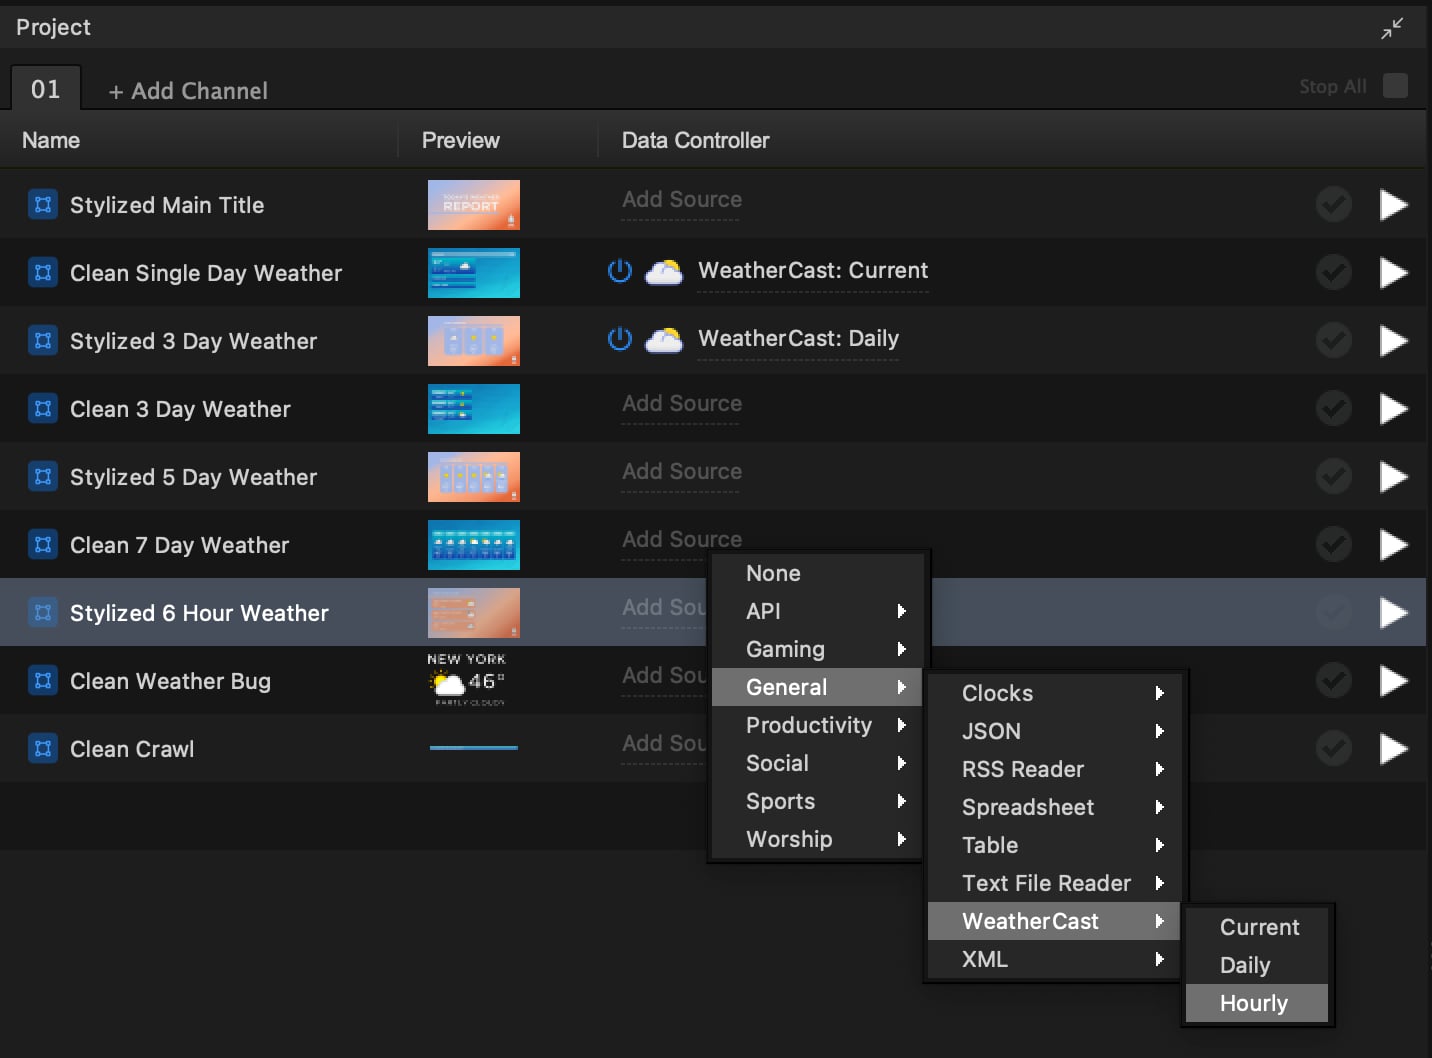
2. From the Project List, locate the Data Controller column for the graphic layer you want to add the WeatherCast to. Select **Select a Datasource** > **Weather** > **WeatherCast** > **Current**.
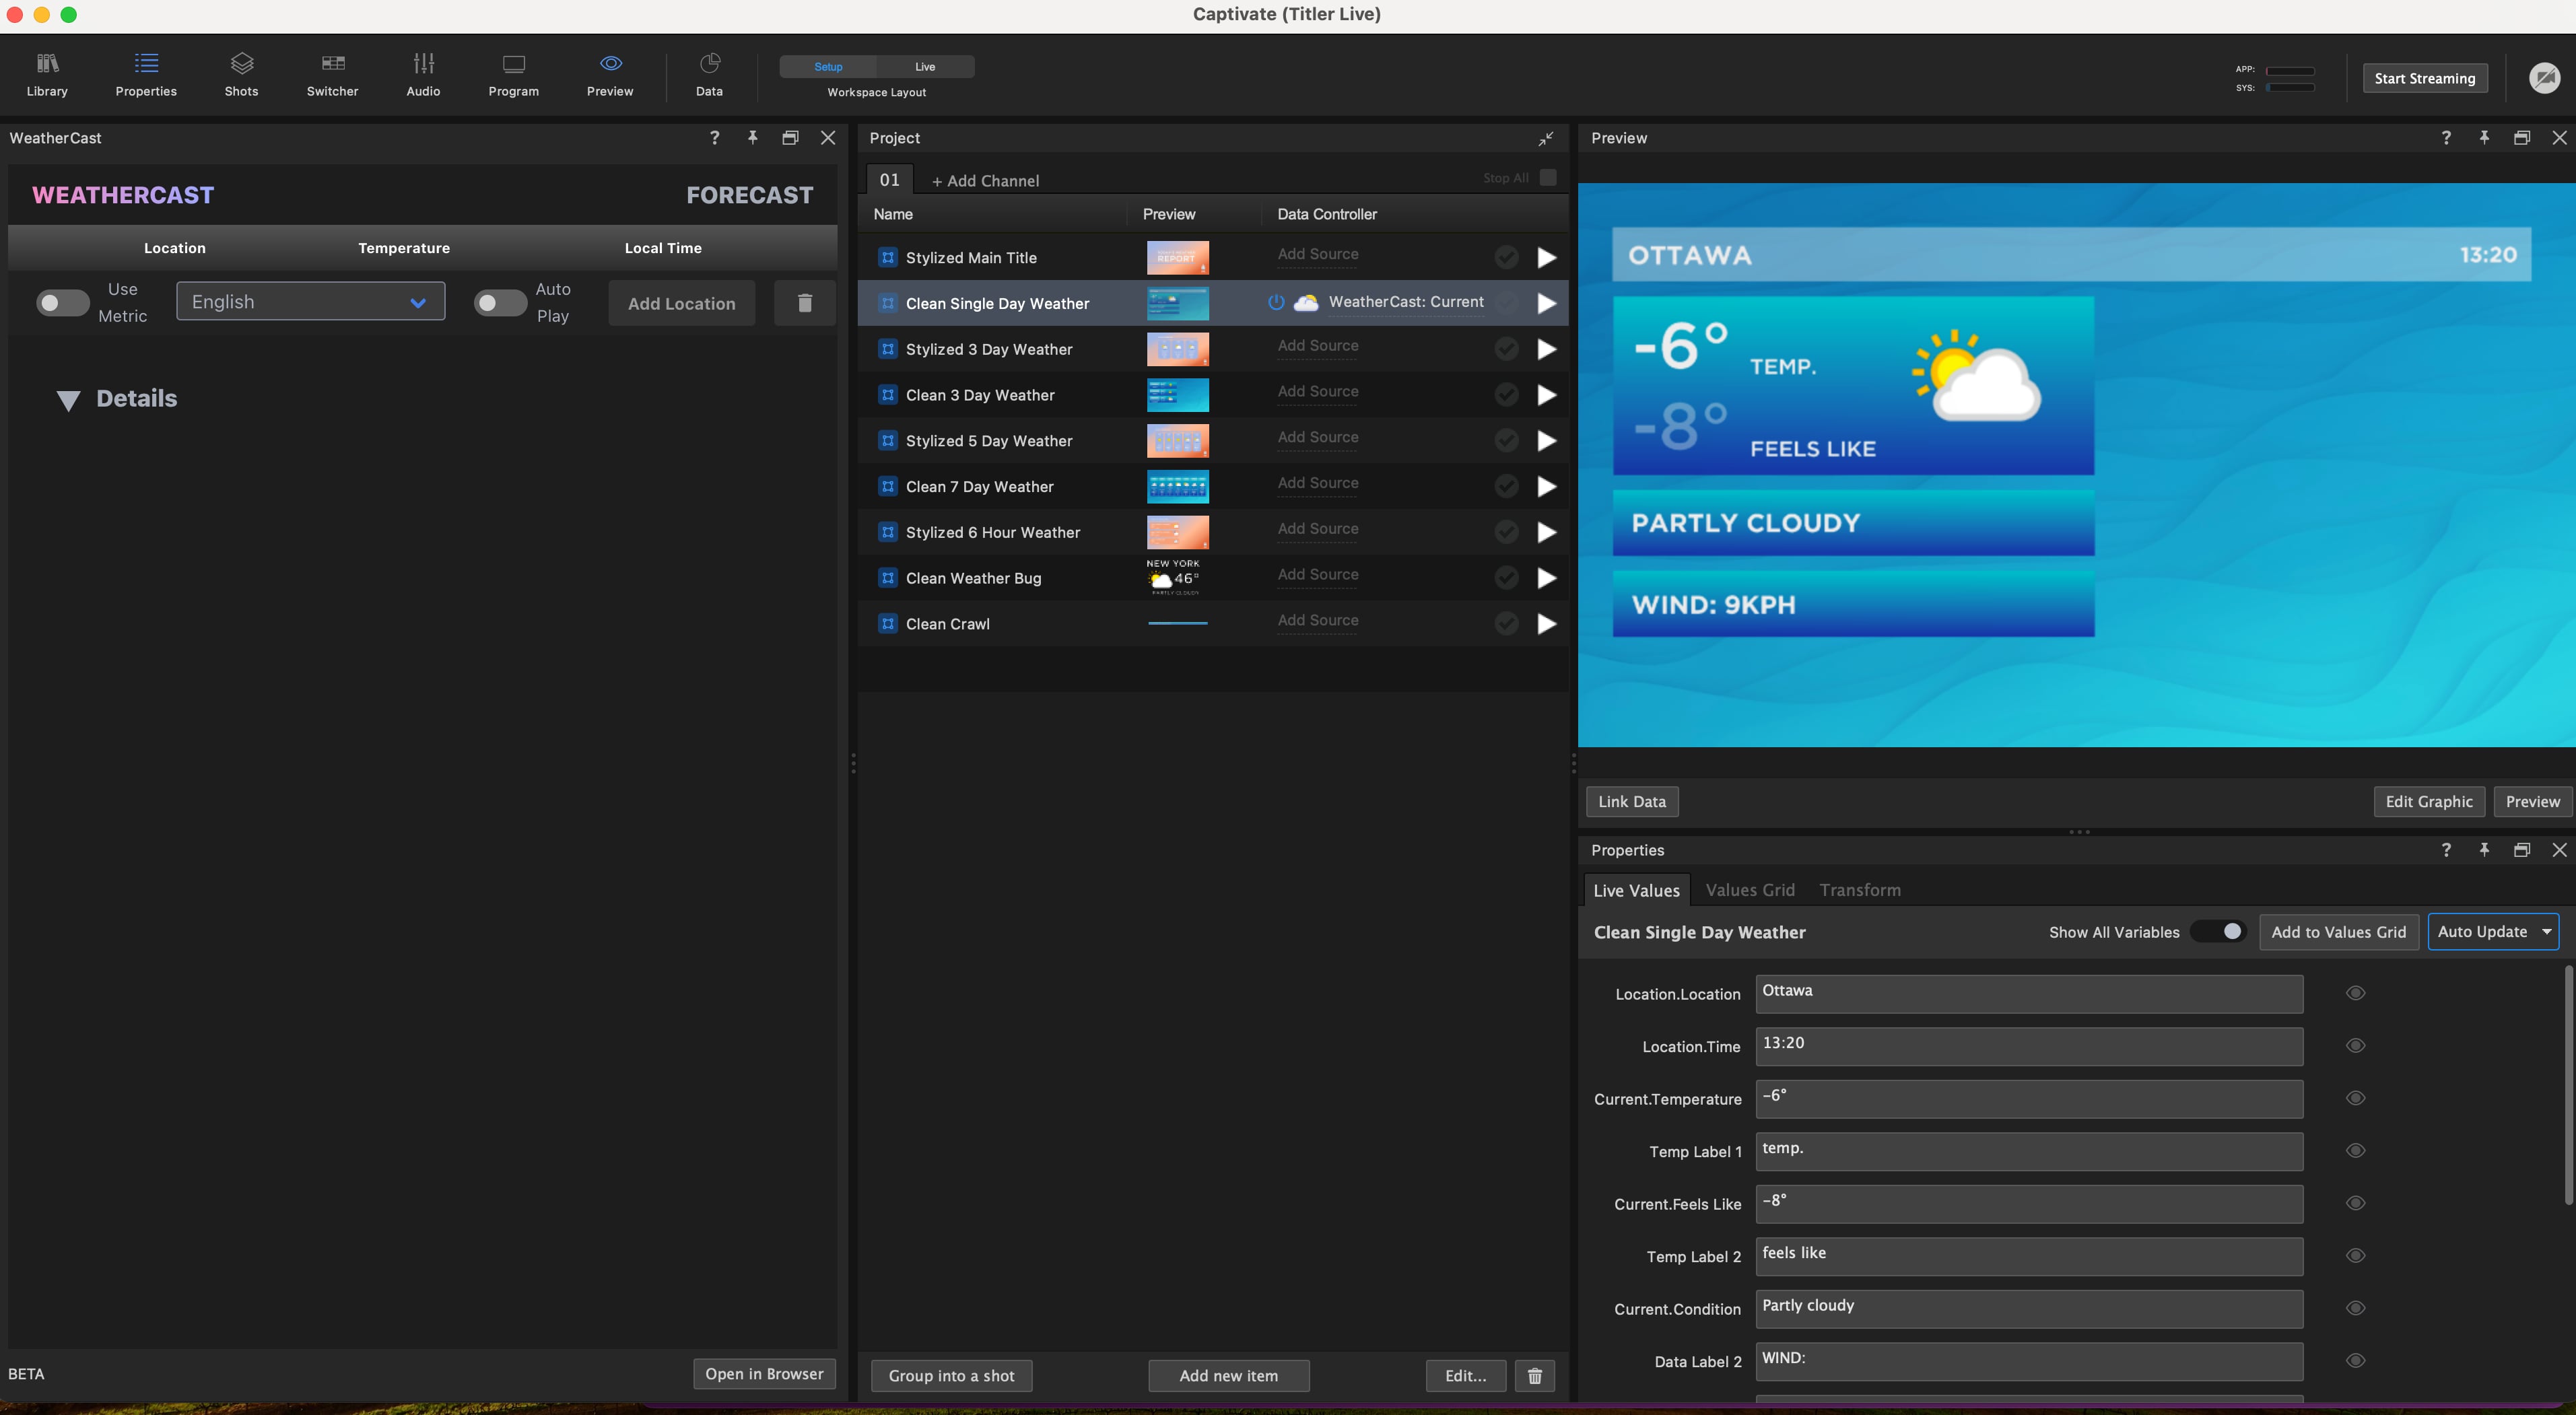
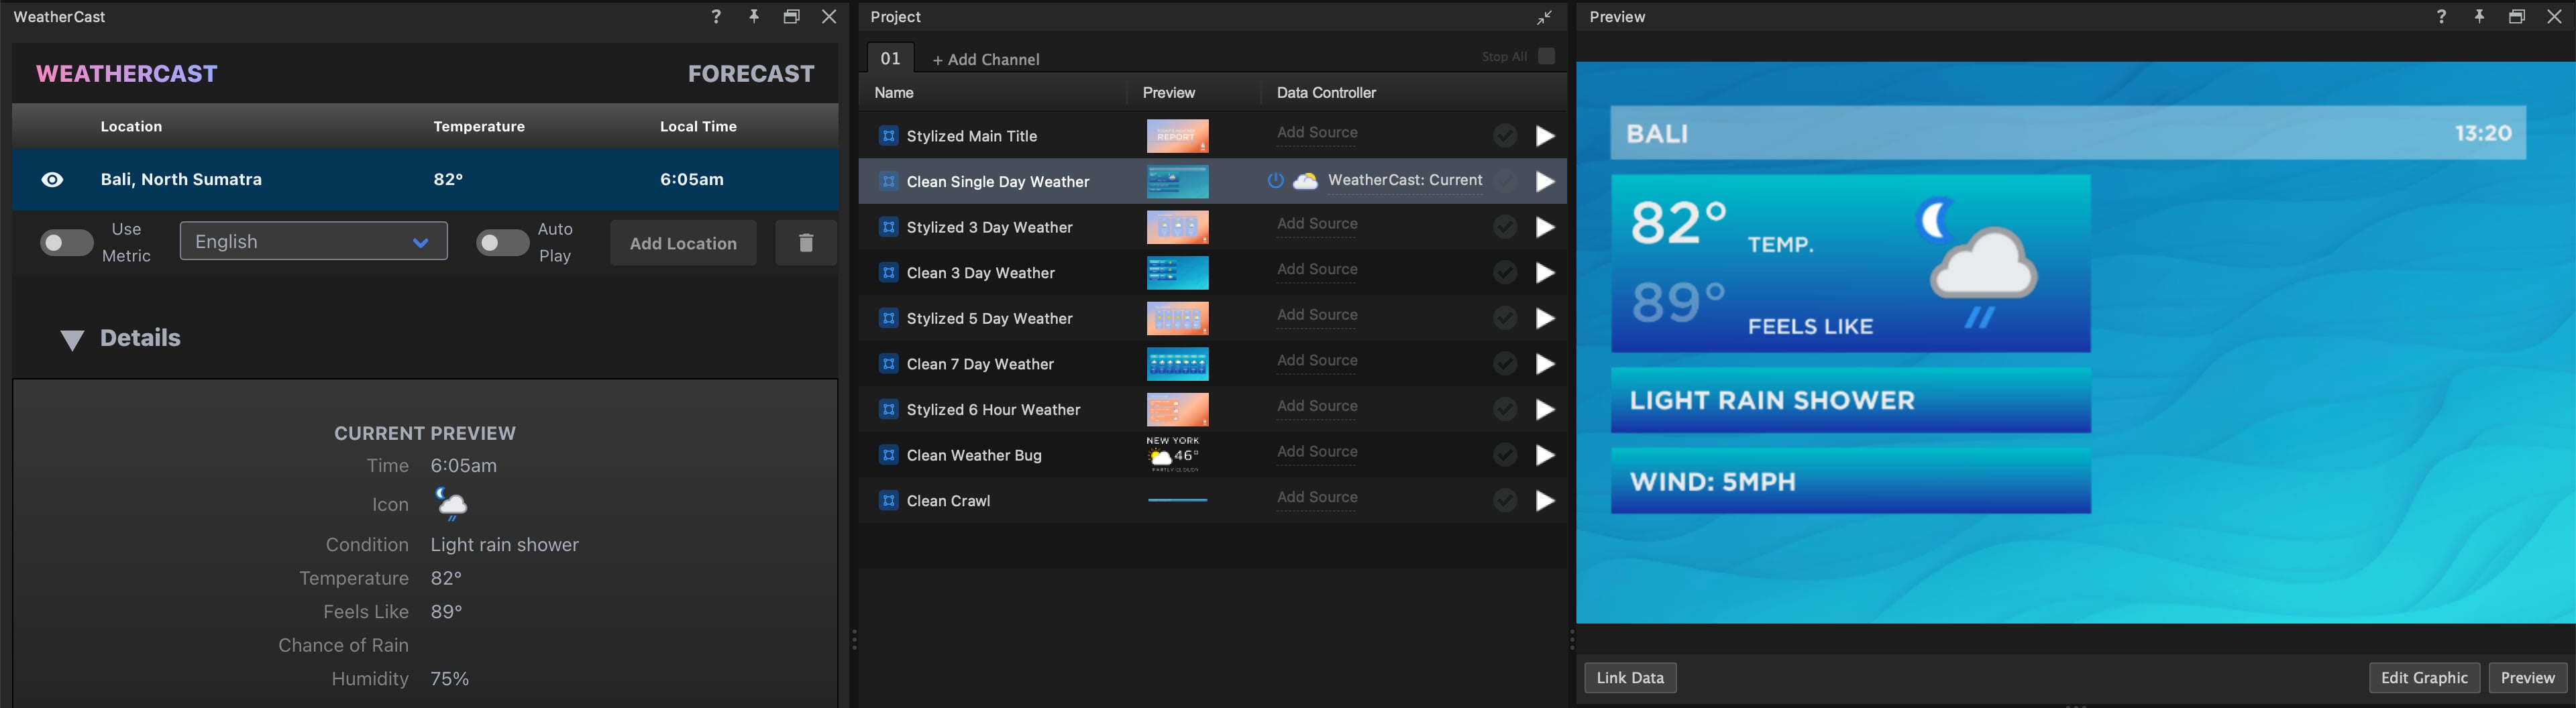
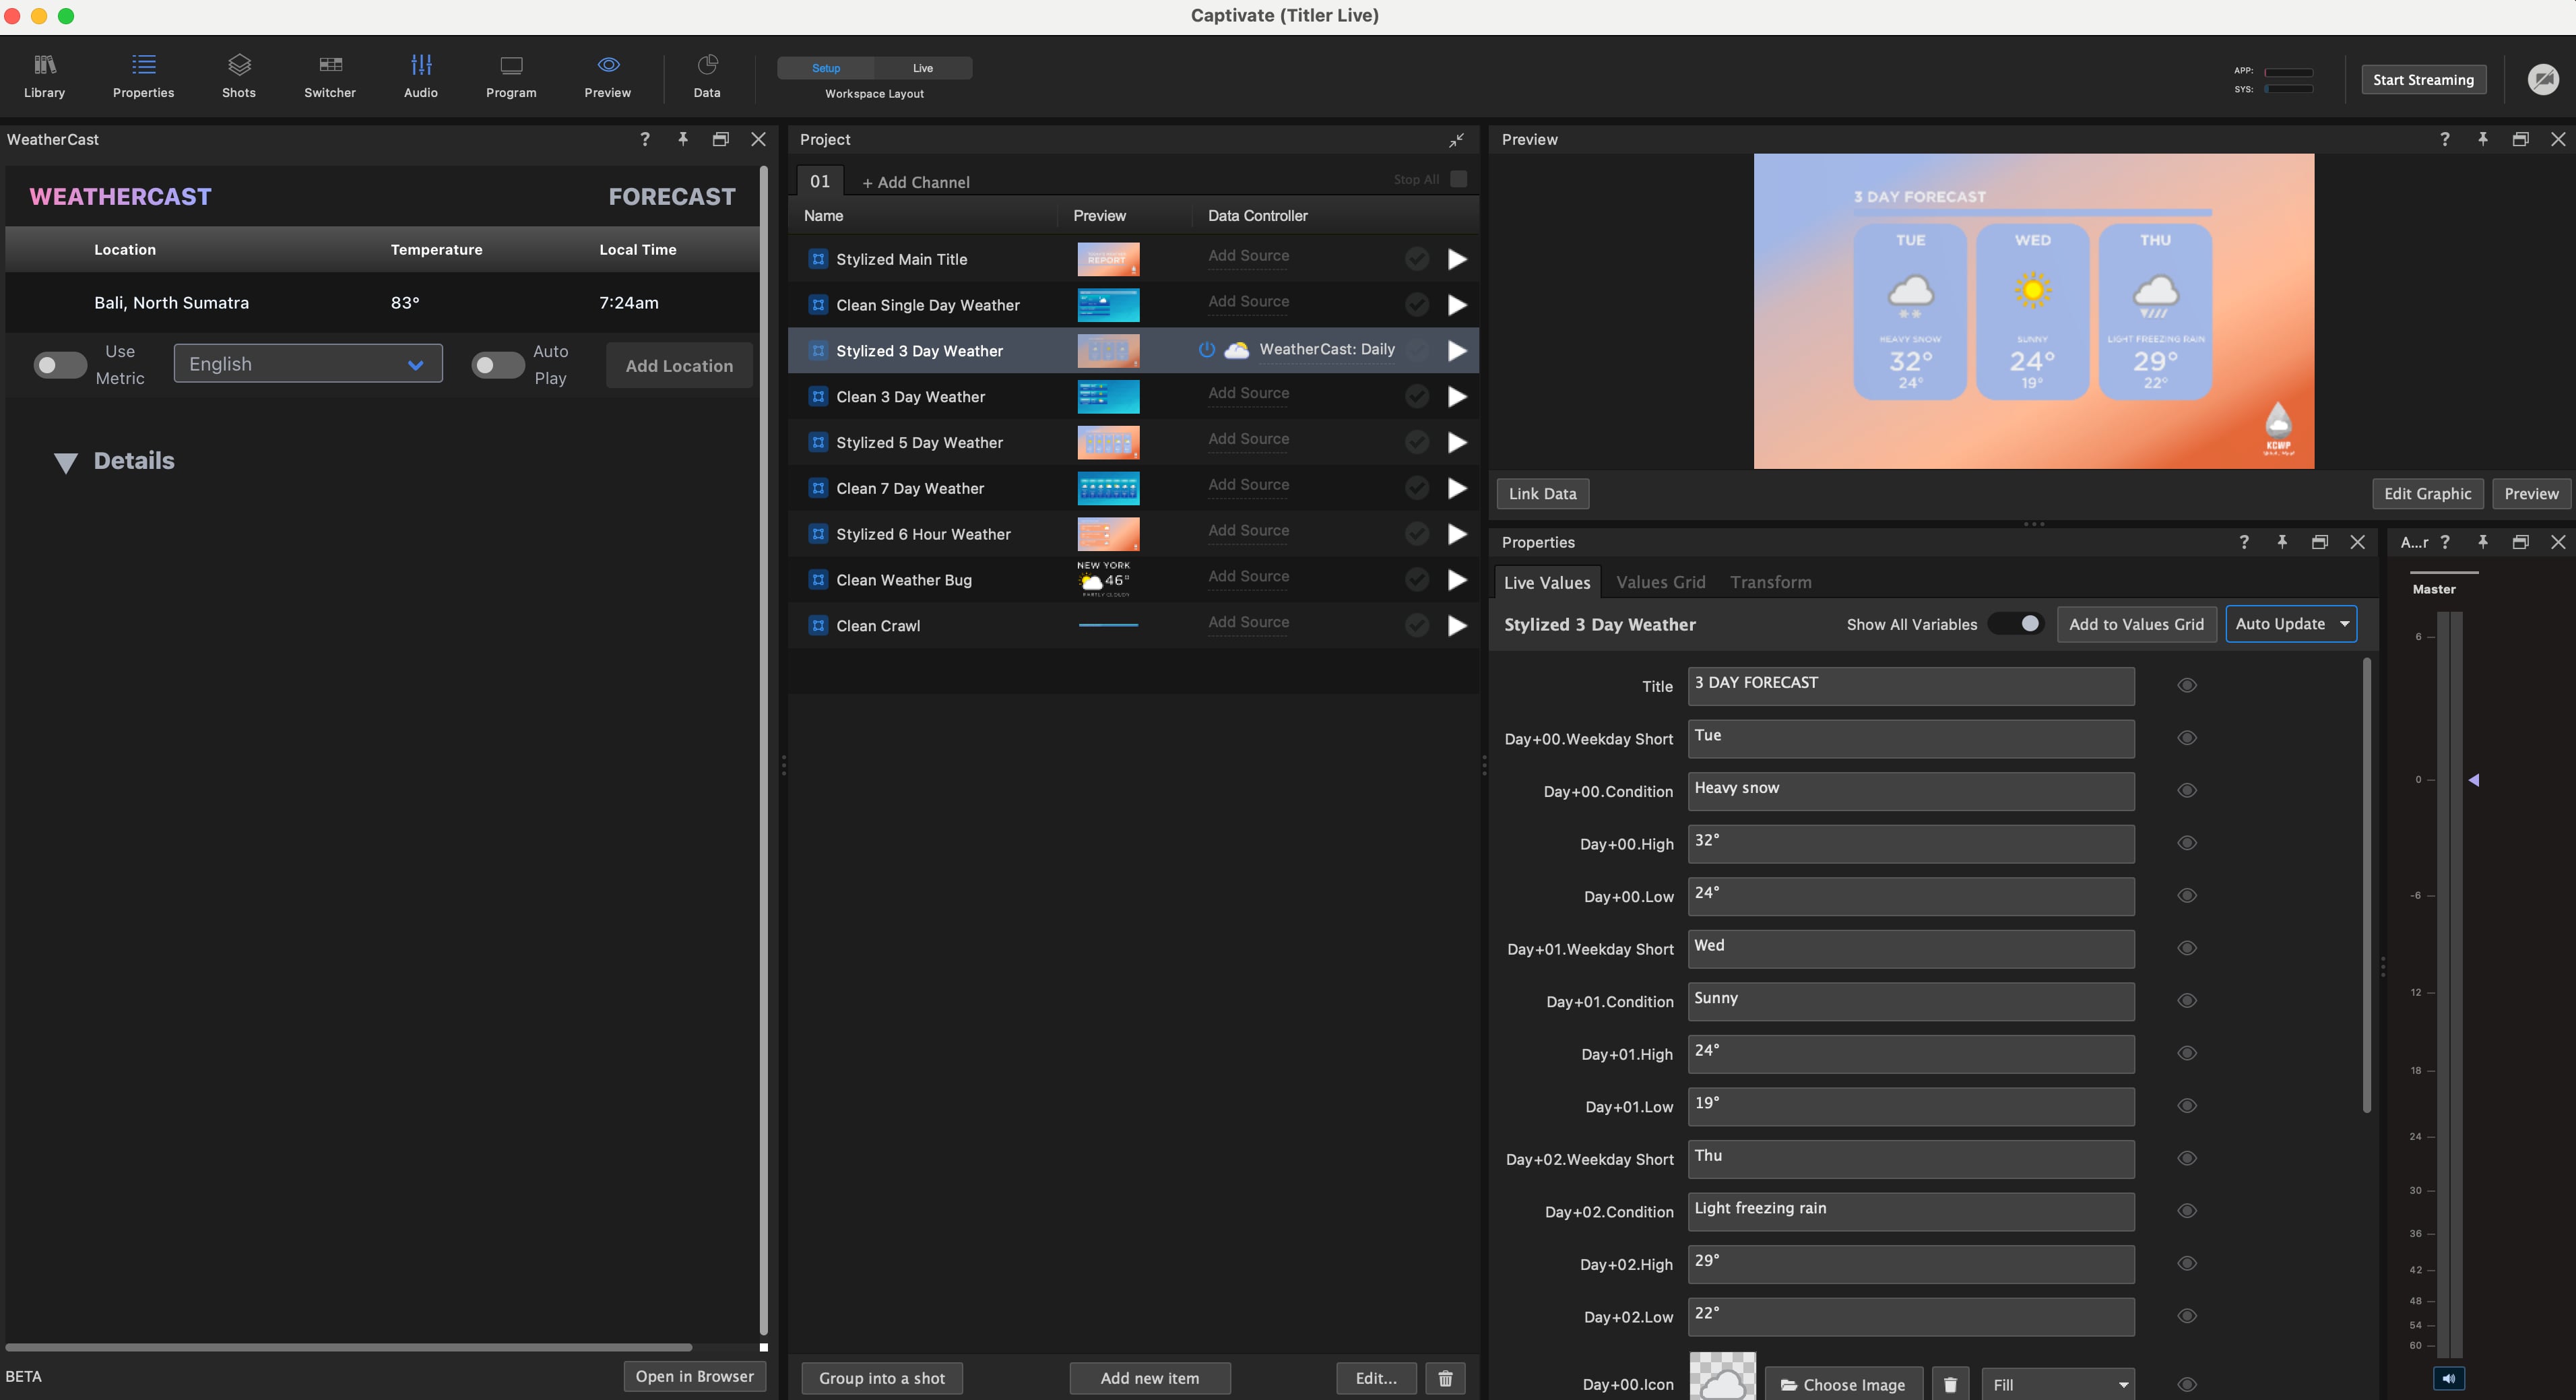
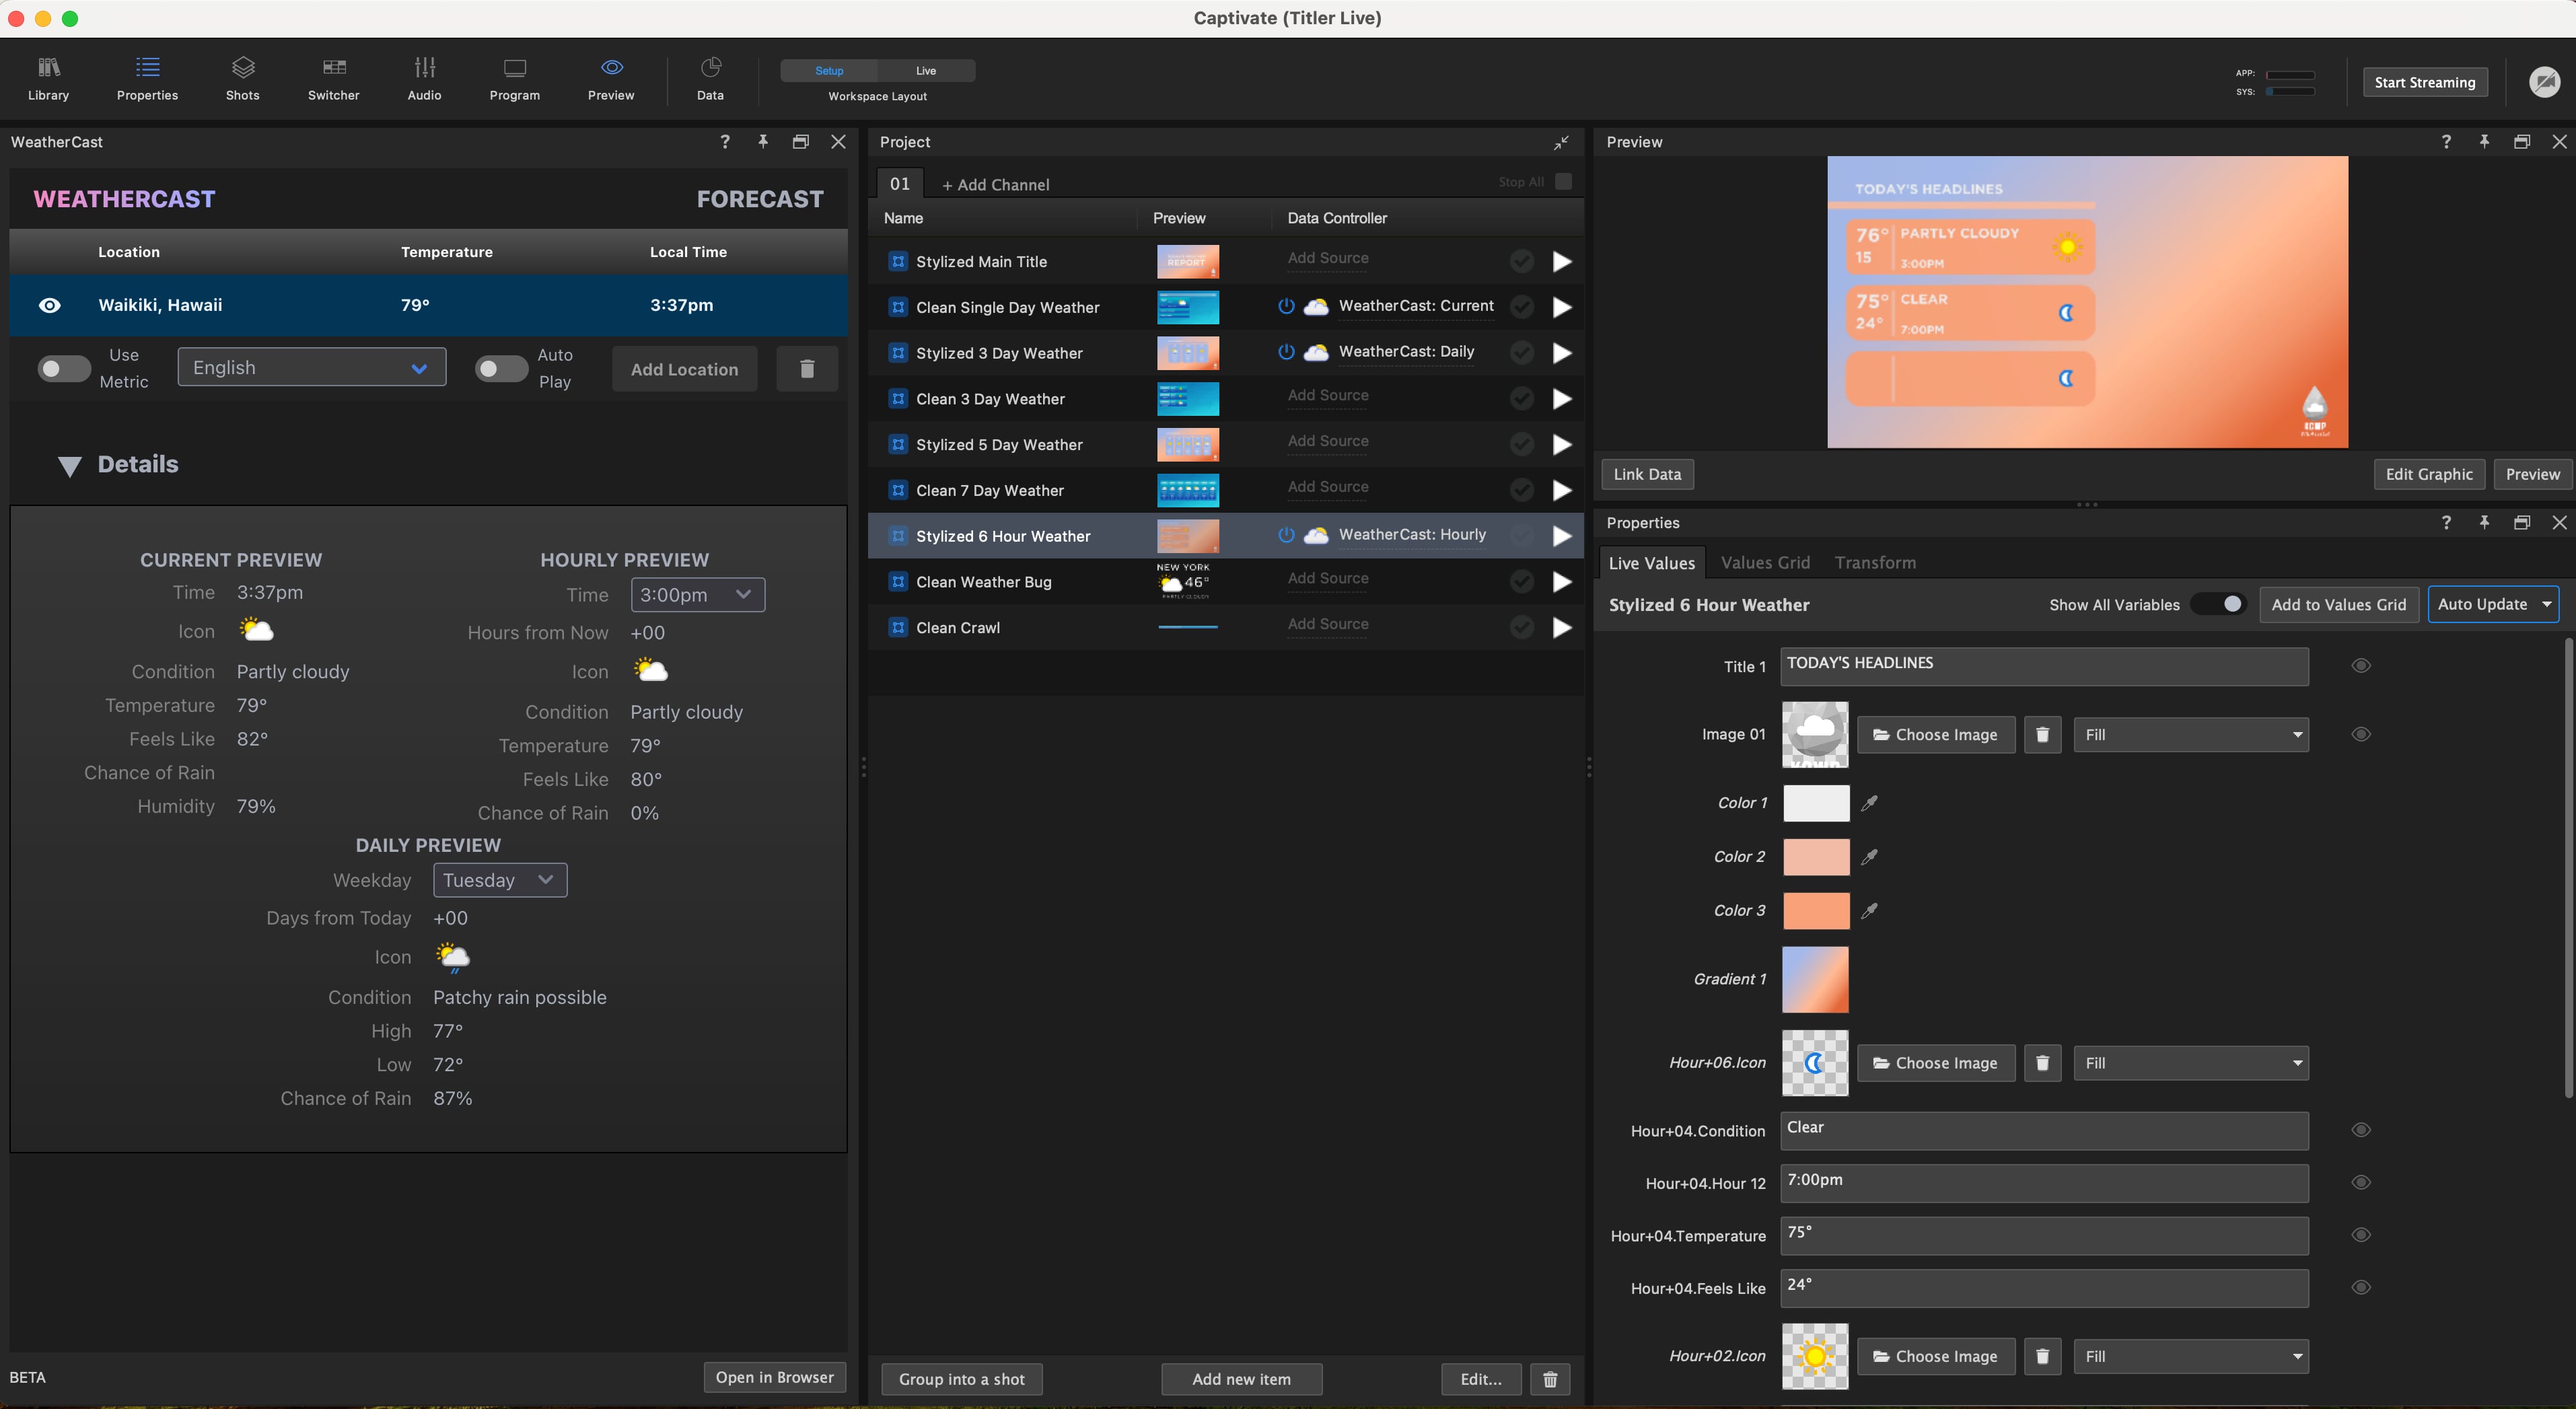
3. The **WeatherCast** Data Controller will appear as a tab in the Layer Properties panel and under the Data Controller column in the Project List for that graphic. In addition, the graphic’s input and its variables appear in the Live Values tab in the same panel.
**💡 TIP**\
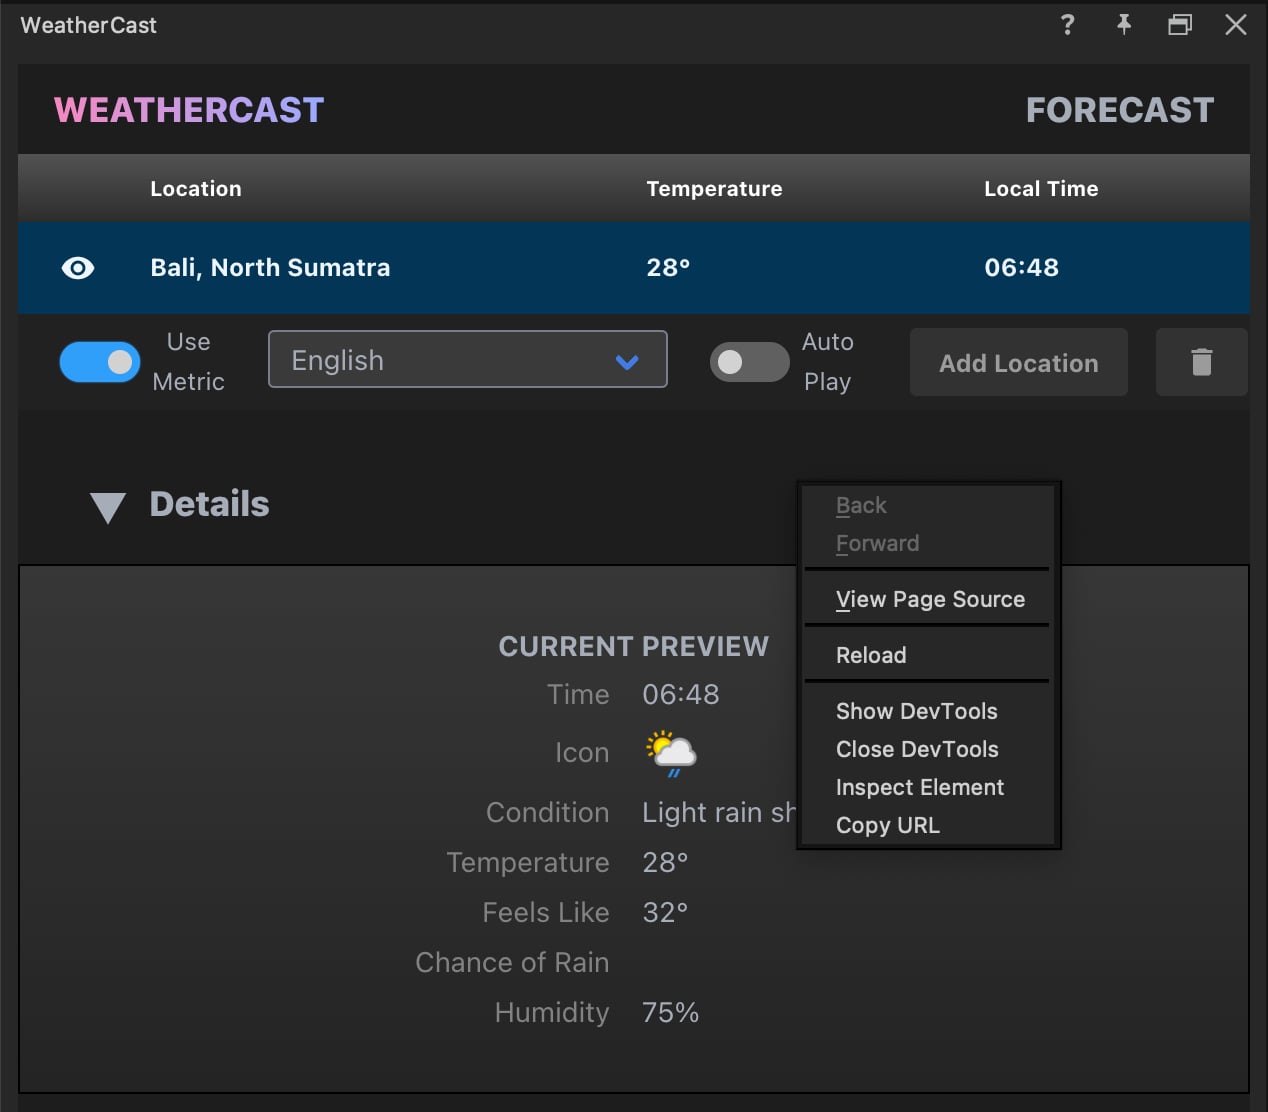
You can move the WeatherCast tab to another location on the interface by dragging from the top of the panel to hover over the seam of the desired location. Once the panels slide to make room, you can drop to redock.
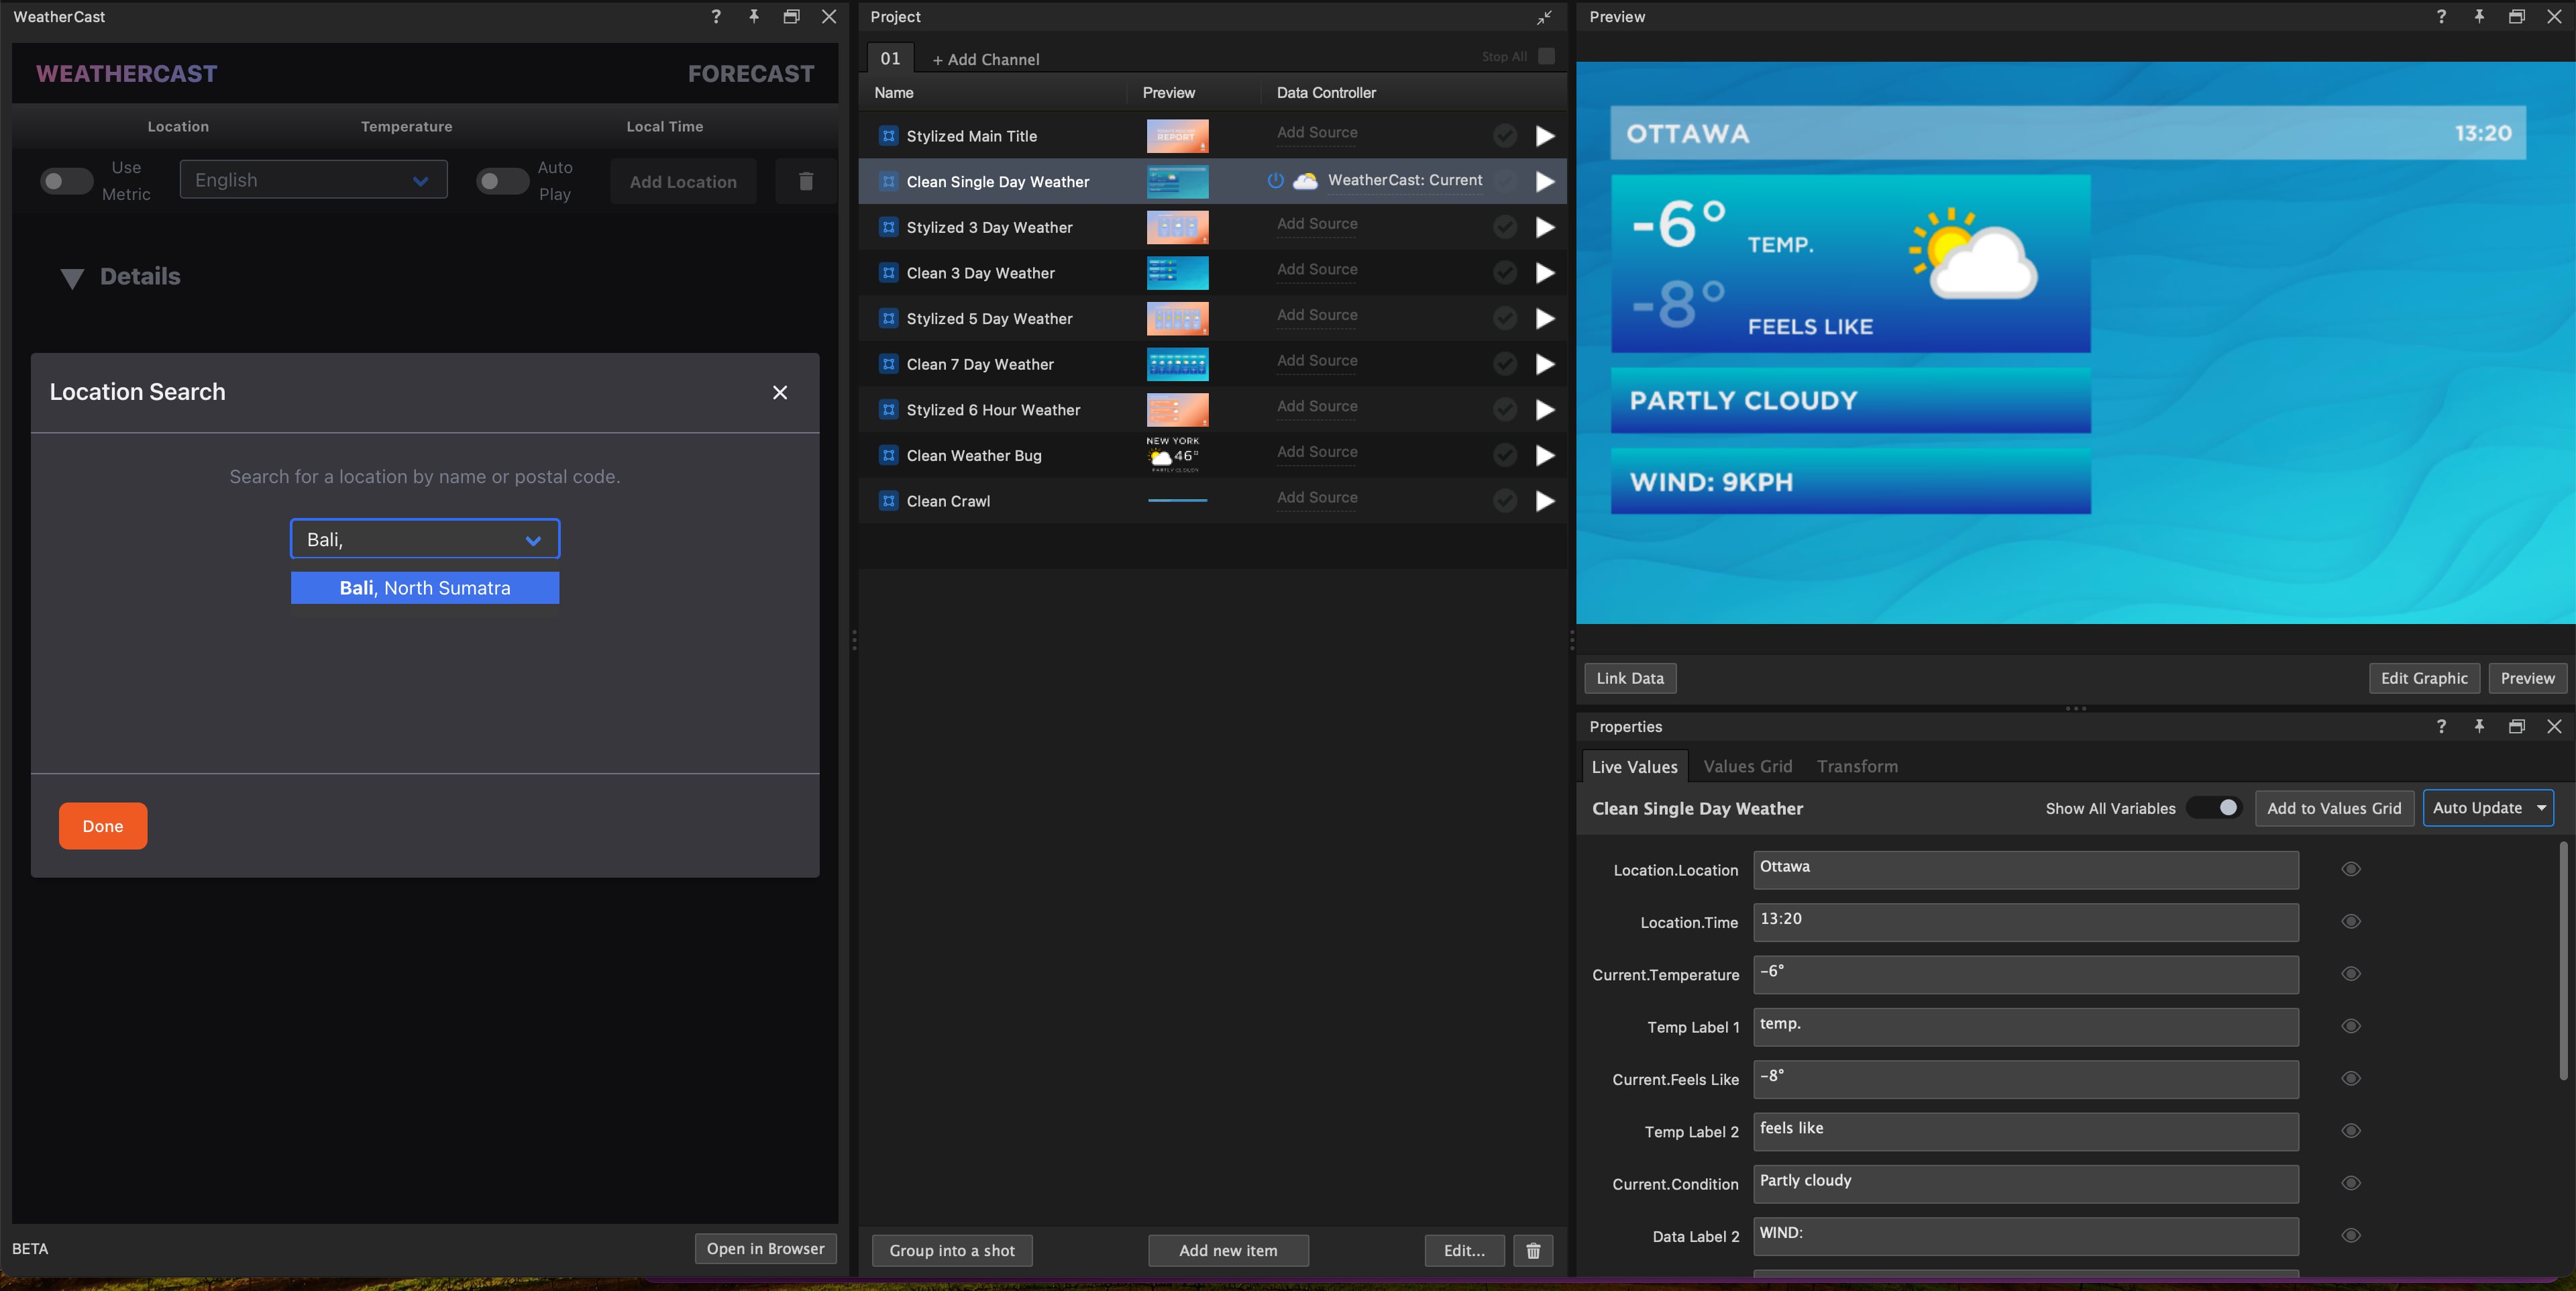
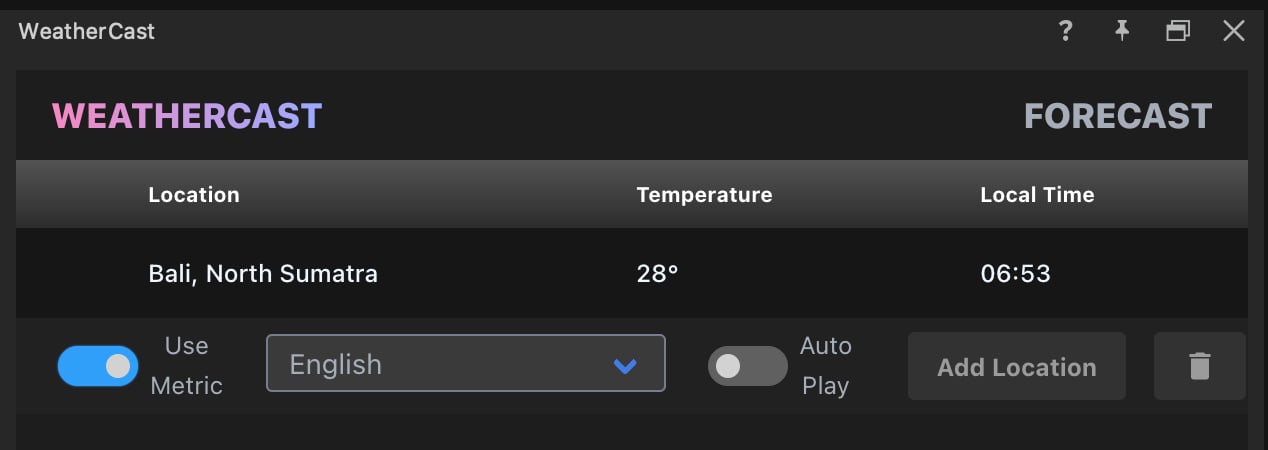
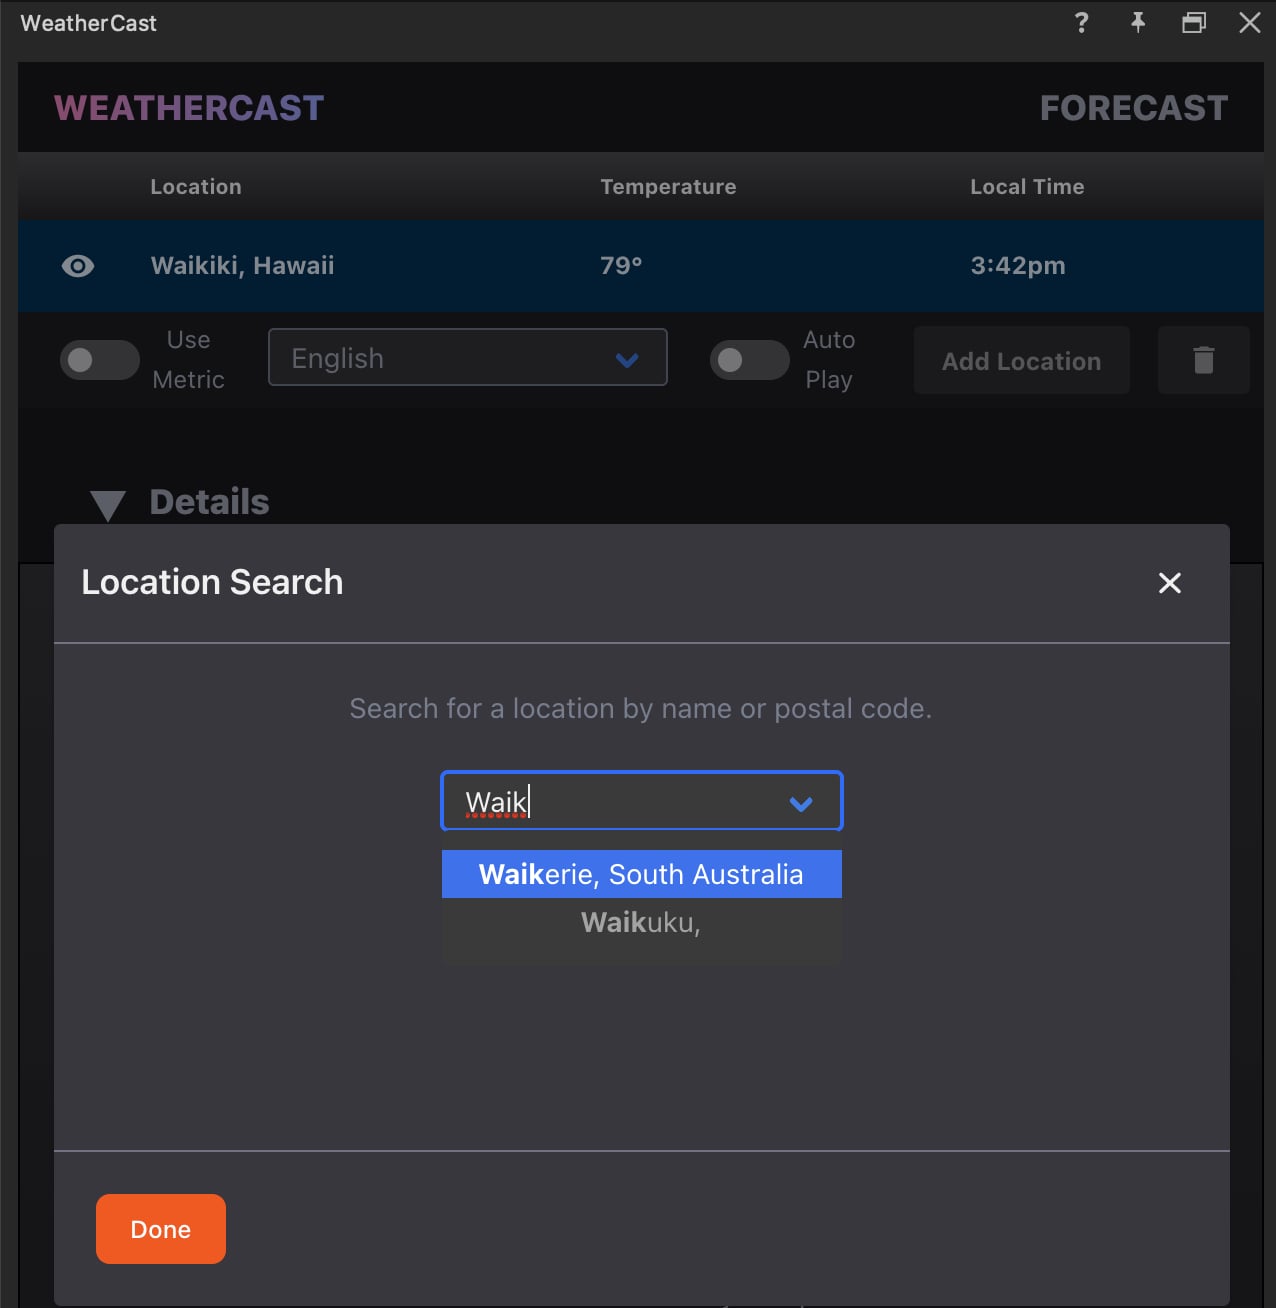
4. In the WeatherCast panel select your desired language from the dropdown and click **Add Location** in the input box on the top right of the panel to open a search window.
5. Type city, country, or zip code of your desired location which should auto-populate options based on your entry > Select Location > click **Done** to close the window. Allow WeatherCast a moment to retrieve and populate real-time data. You should now see the selected location listed along with details in the WeatherCast panel.
**💡 TIP**\
To add multiple cities to your broadcast, simply repeat for amount of locations desired > click **Done** to close the window.
6. Toggle on **Use Metric** in the lower-left of the WeatherCast control row (below the location list, alongside the language dropdown, Auto Play toggle, Add Location button, and trash can), if metric displays are desired.
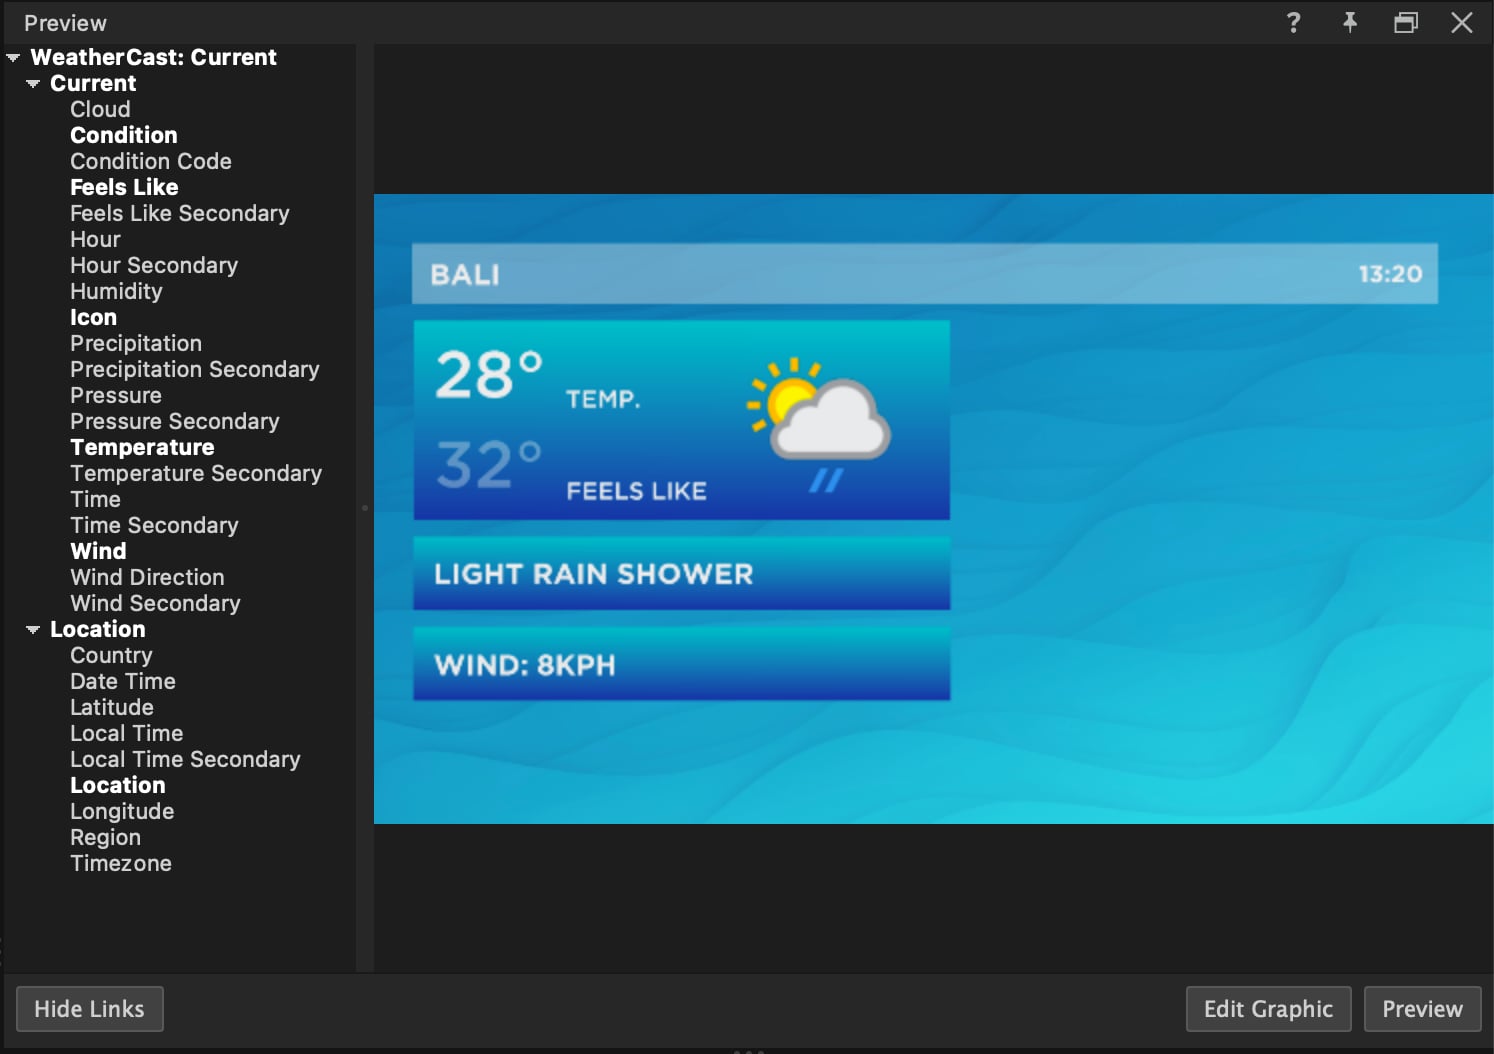
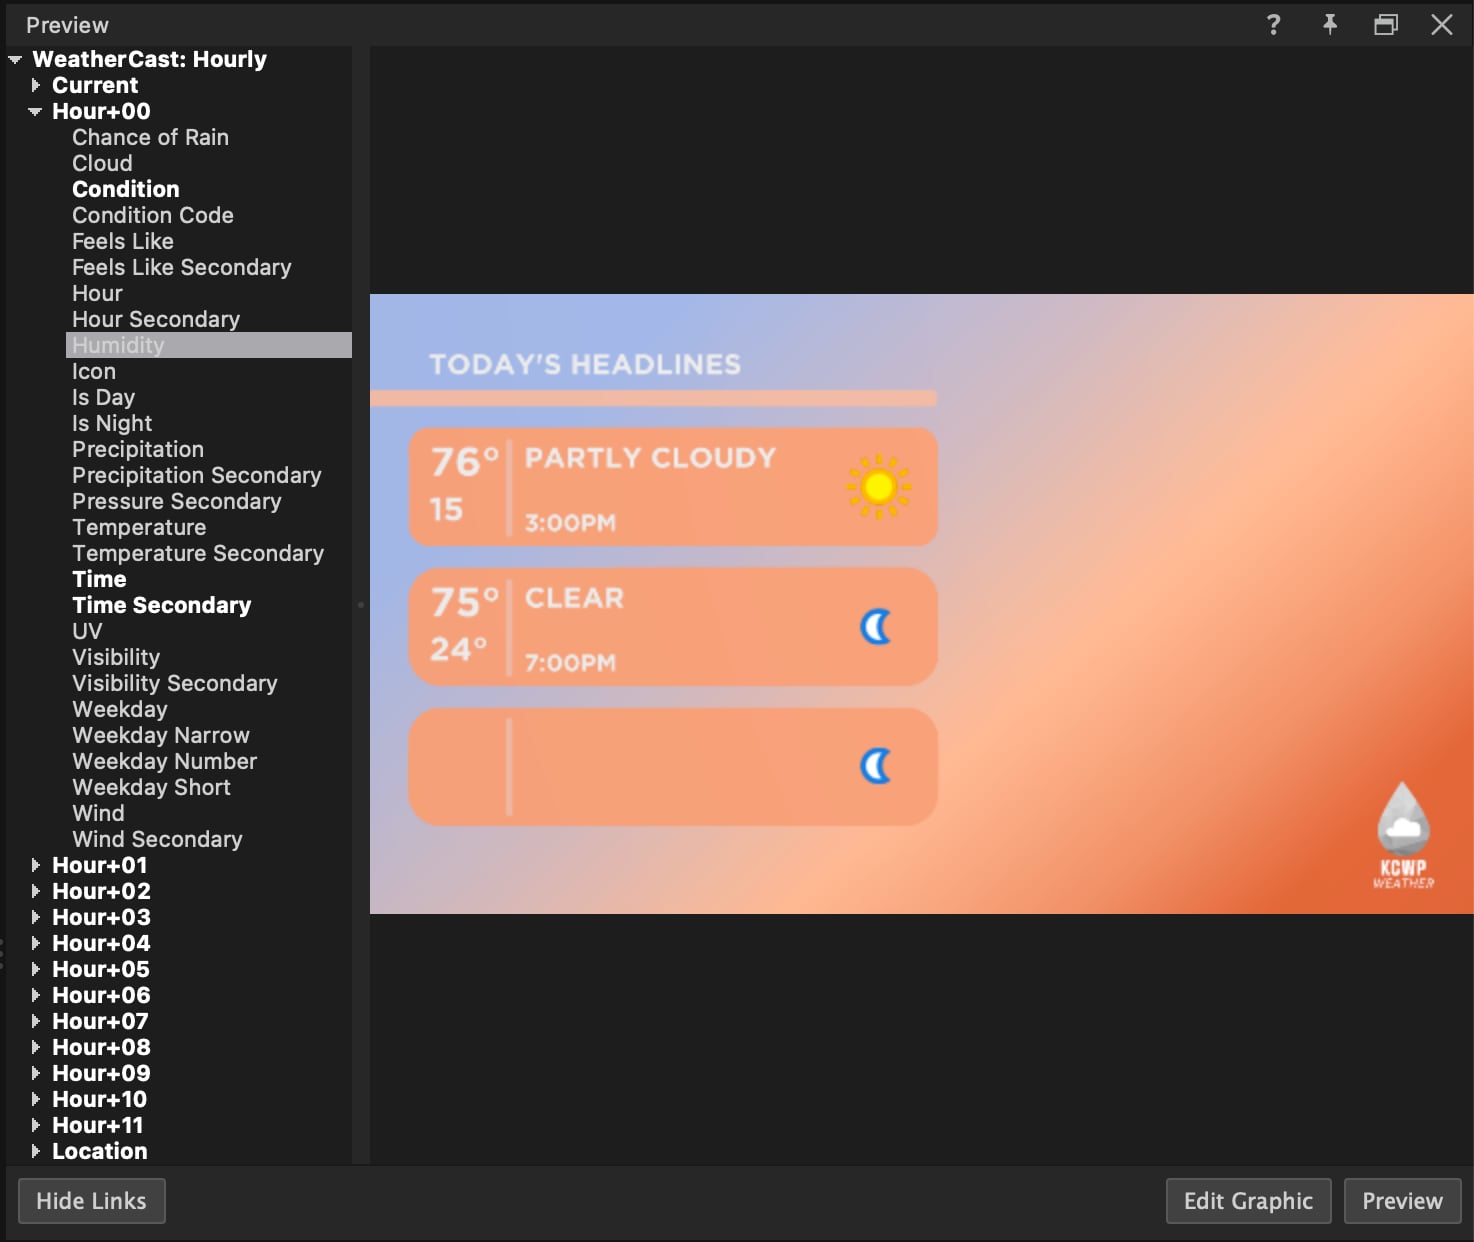
7. Click the **Link Data** button in the Preview panel to view the WeatherCast input and variables. (If the input’s variables aren’t visible, expand the list by sliding the size of the sidebar to the right or resizing the panel from the 3 dots along the seams.)
8. Click and drag a WeatherCast variable onto an object in your graphic. Repeat this step for each variable you want to include in your graphic. For the Current Day weather display, the variables available to connect to the graphic include:
* Condition
* Temperature
* Feels Like
* Hour
* Humidity
* Icon
* Cloud
* Precipitation
* Pressure
* Time
* Wind
* Wind Direction
* Location
* Country
* Date Time
* Latitude
* Local Time
* Longitude
* Region
* Timezone
**💡 TIP**\
To disconnect a variable from an object in your graphic, right-click that variable in the Edit/Preview panel and re-select to uncheck that variable.
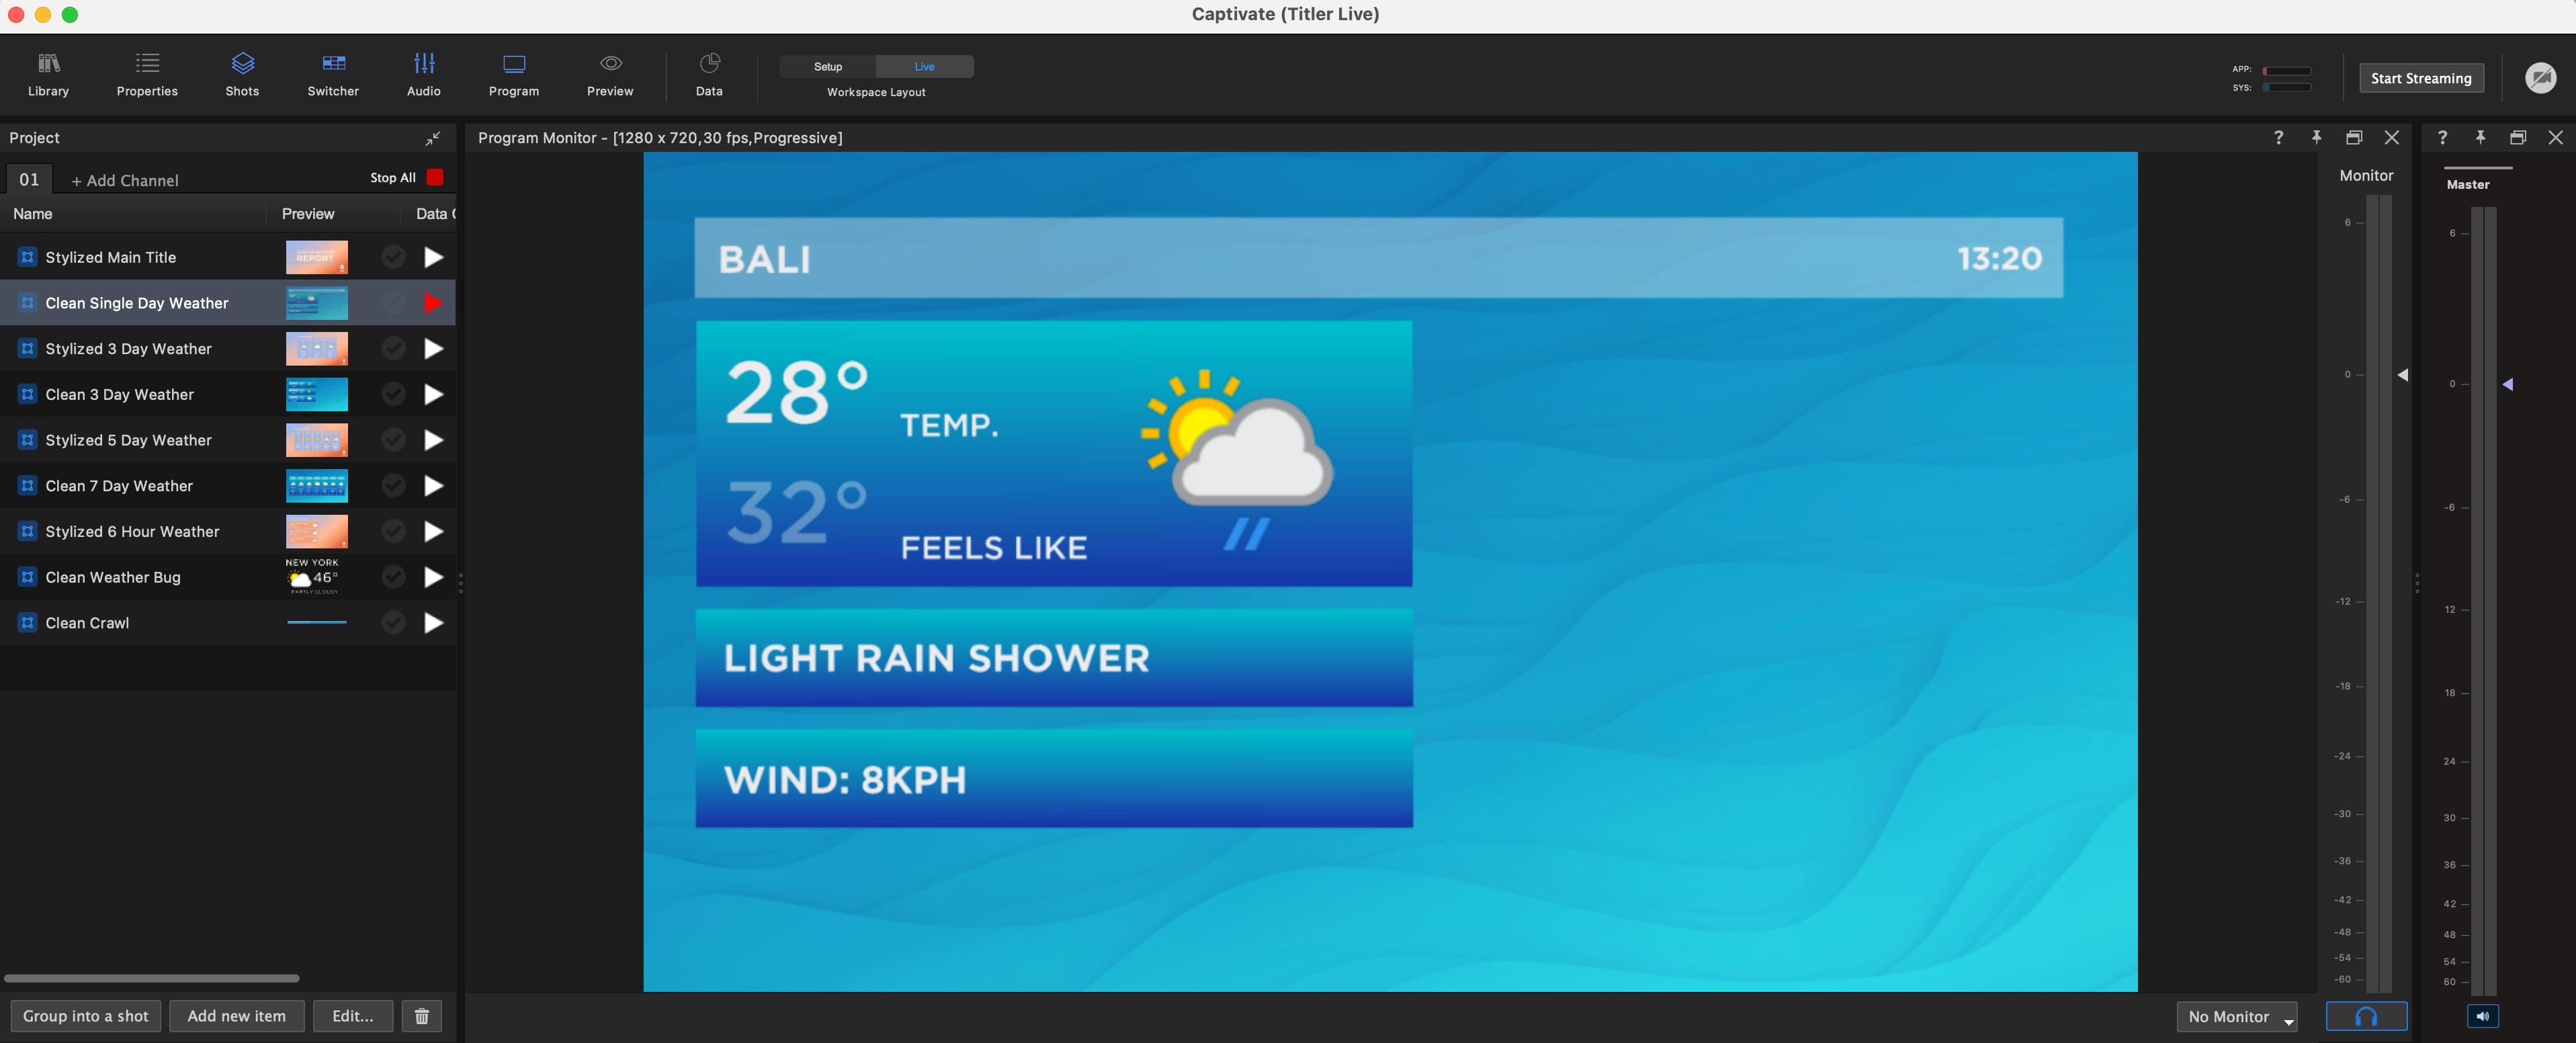
The data in your WeatherCast input should now be visible in your graphic and updated in real time. Test by playing live and viewing in your Program Monitor.
**💡 TIP**\
If you run into any issues with your Data Controller not connecting properly, showing white, or disconnection, try right-clicking anywhere in the panel and select **Reload**. You can also reconnect in the Data Controller column by selecting **None** first, then reconnecting WeatherCast.
## Setting up a Multi-Day Forecast
1. In Captivate’s playout interface, navigate to the Library > **Weather** to access all of our pre-made weather-themed graphic templates. Drag and drop one of the multi-day weather graphics into your Project List and select to highlight.
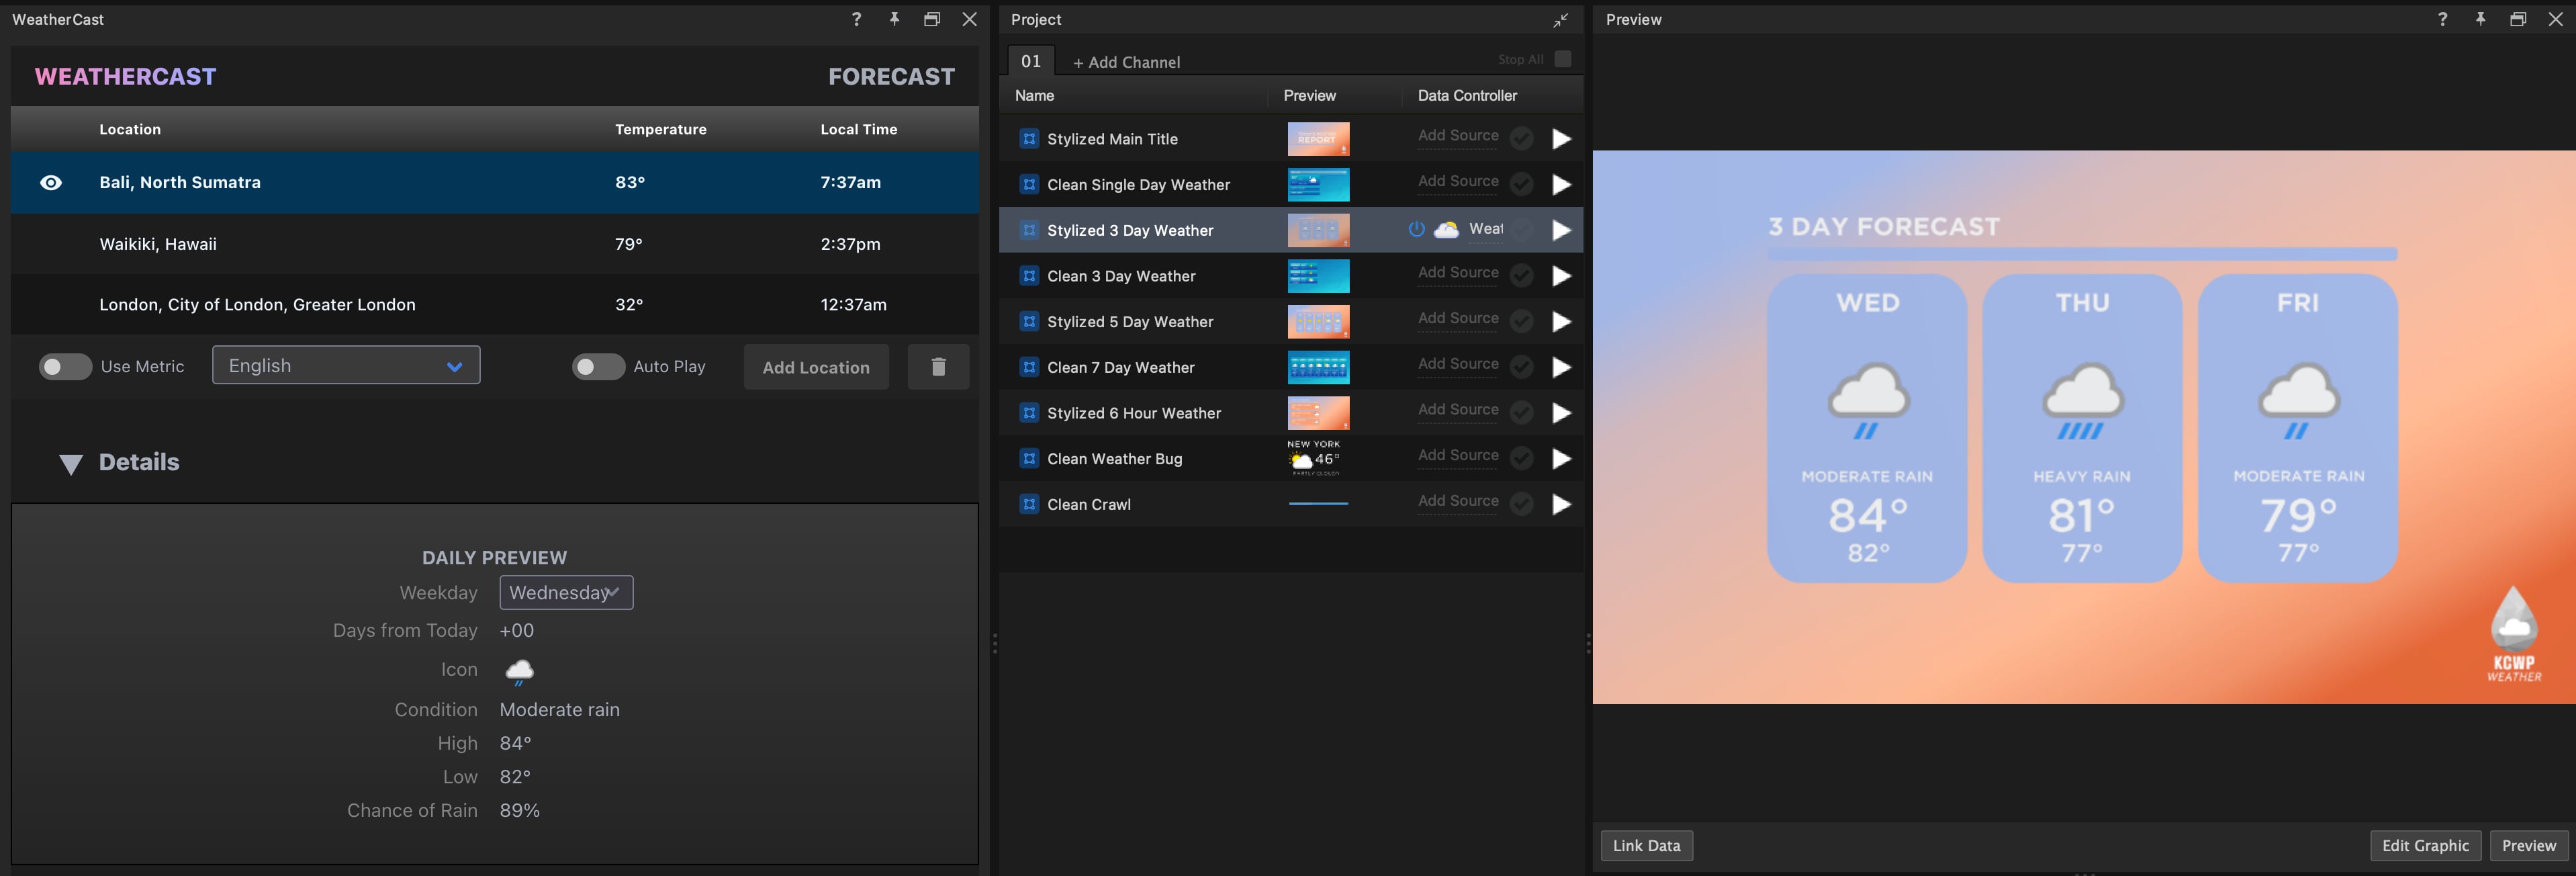
2. From the Project List, locate the Data Controller column for the graphic layer you want to add the WeatherCast to. Select **Select a Datasource** > **Weather** > **WeatherCast** > **Daily**.
3. The WeatherCast Data Controller will appear as a tab in the Layer Properties panel and under the Data Controller column in the Project List for that graphic.
4. In the WeatherCast panel select your desired language from the dropdown and click **Add Location**.
5. Type city, country, or zip code of your desired location, select location, and click **Done**. See [Showcasing Multiple Locations](#showcasing-multiple-locations) for adding multiple cities.
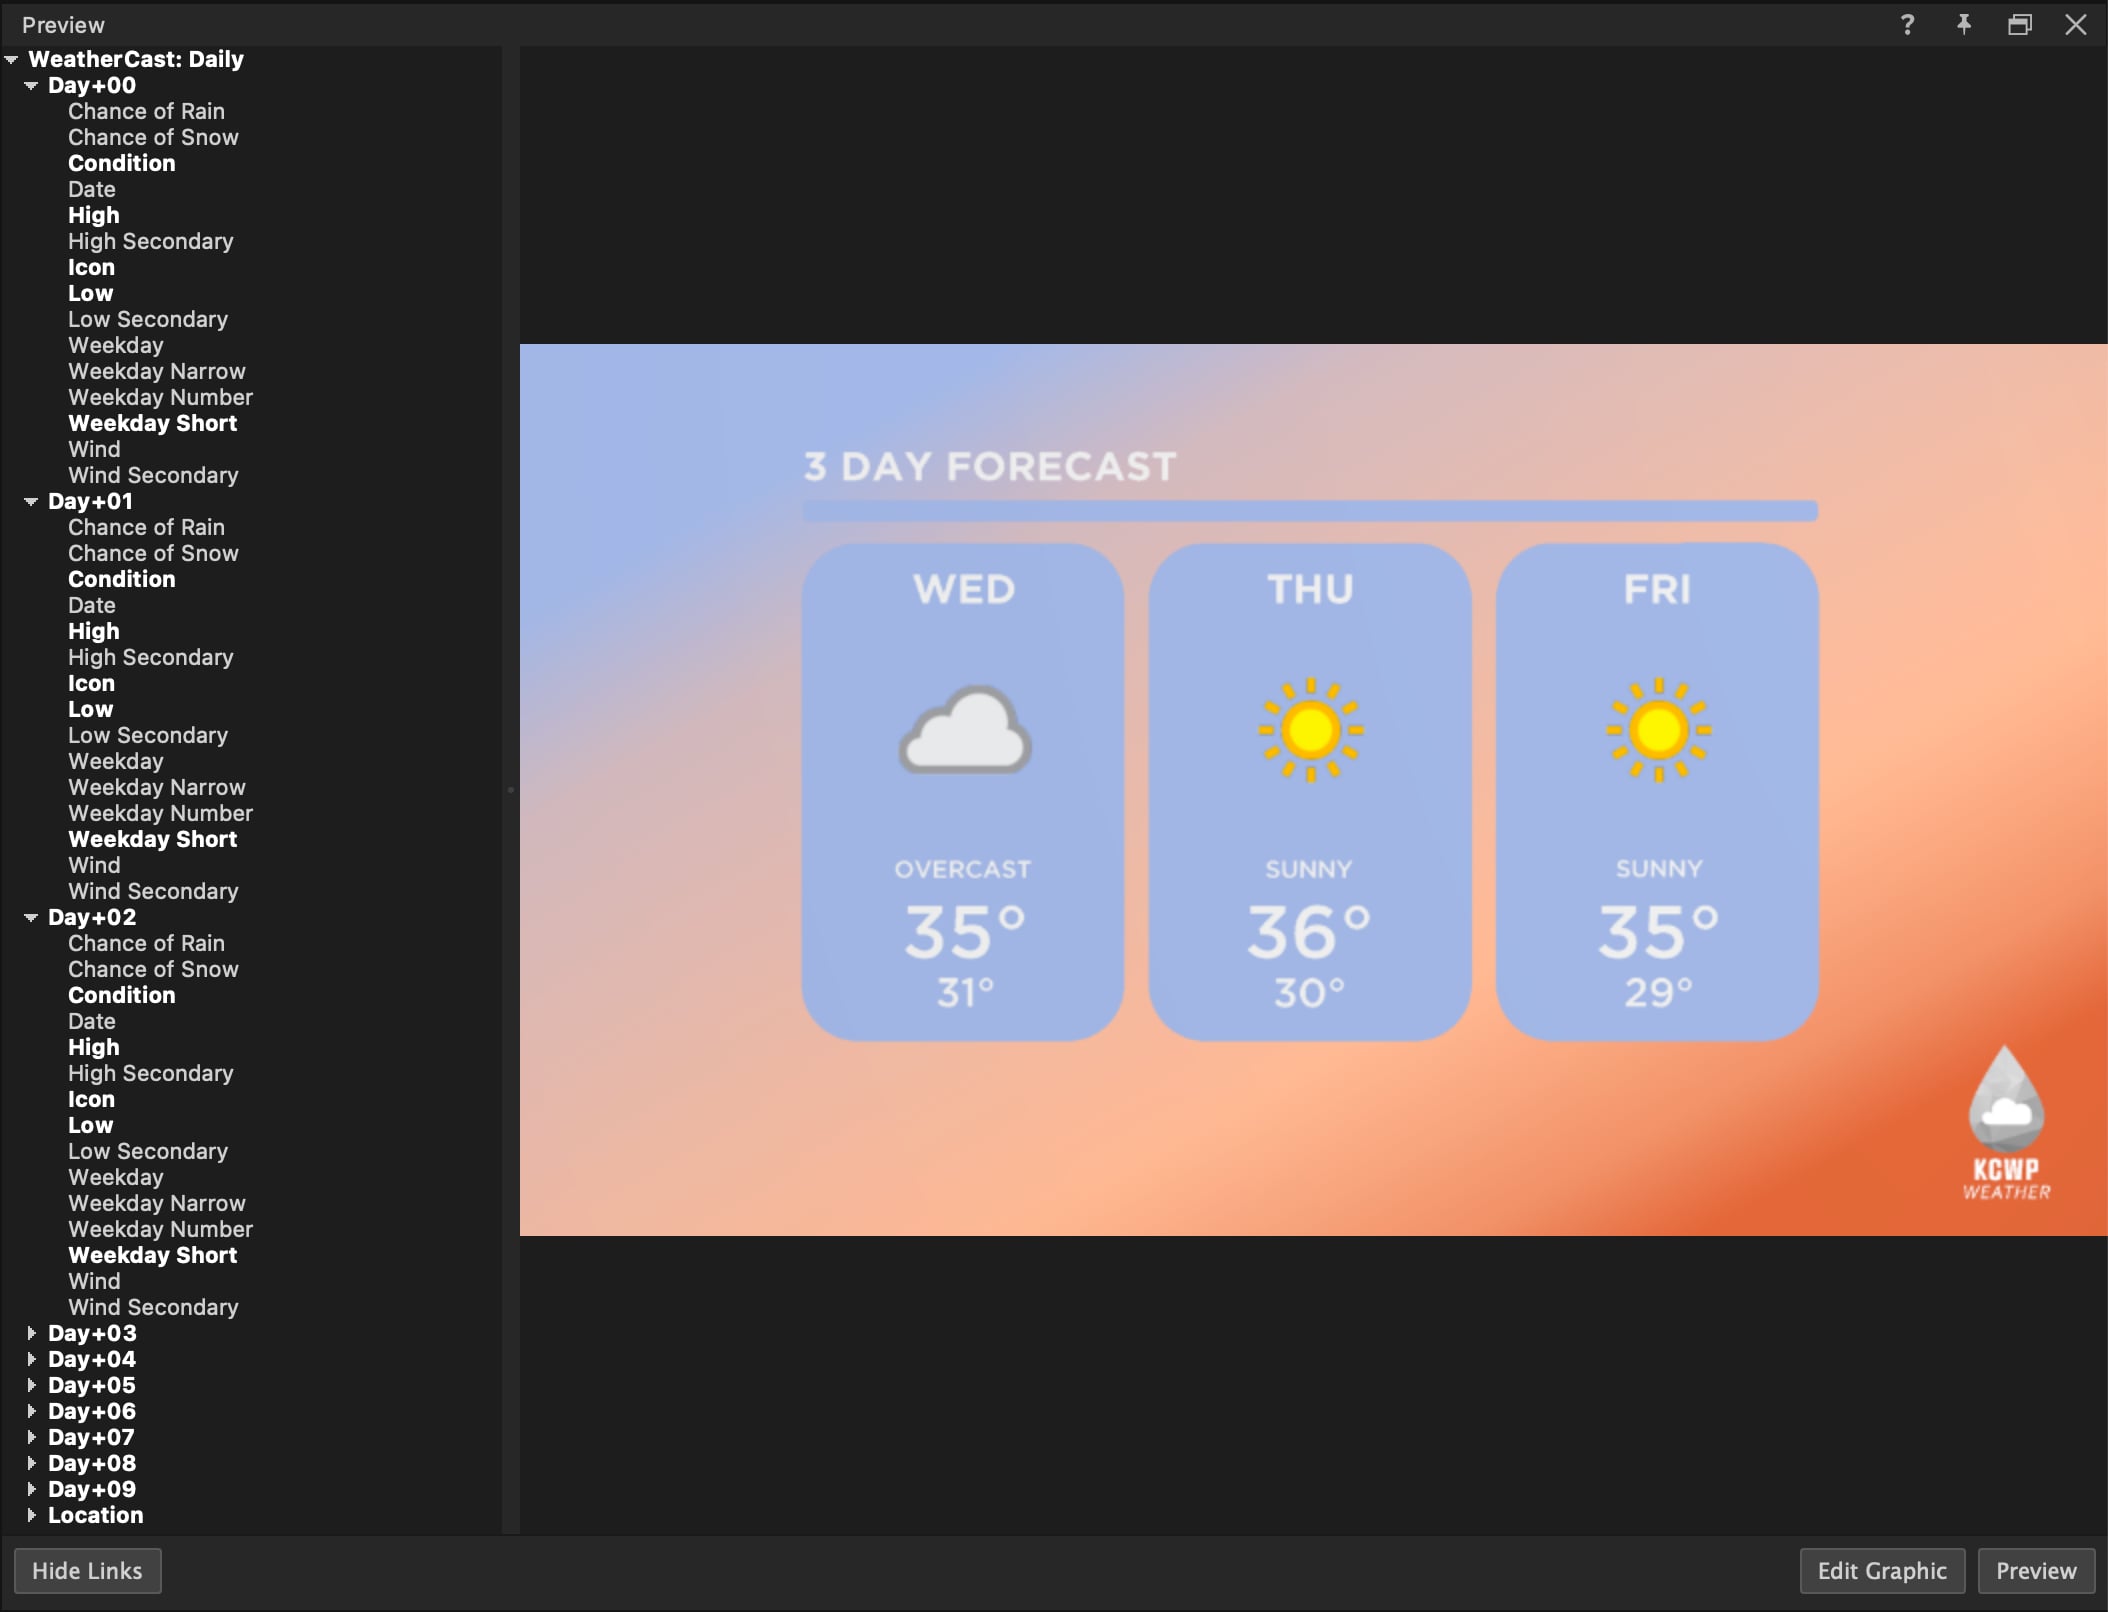
6. Click the **Link Data** button in the Preview panel to view the WeatherCast input and variables.
7. Click and drag a WeatherCast variable onto an object in your graphic. Link only the variables under **Day+00** for the first day, **Day+01** for the second day, **Day+02** for the third day, etc.
For the daily weather display, the variables available to connect to the graphic include:
* Condition
* Temperature
* Chance of Rain
* Chance of Snow
* Date
* High
* Low
* Icon
* Weekday
* Wind
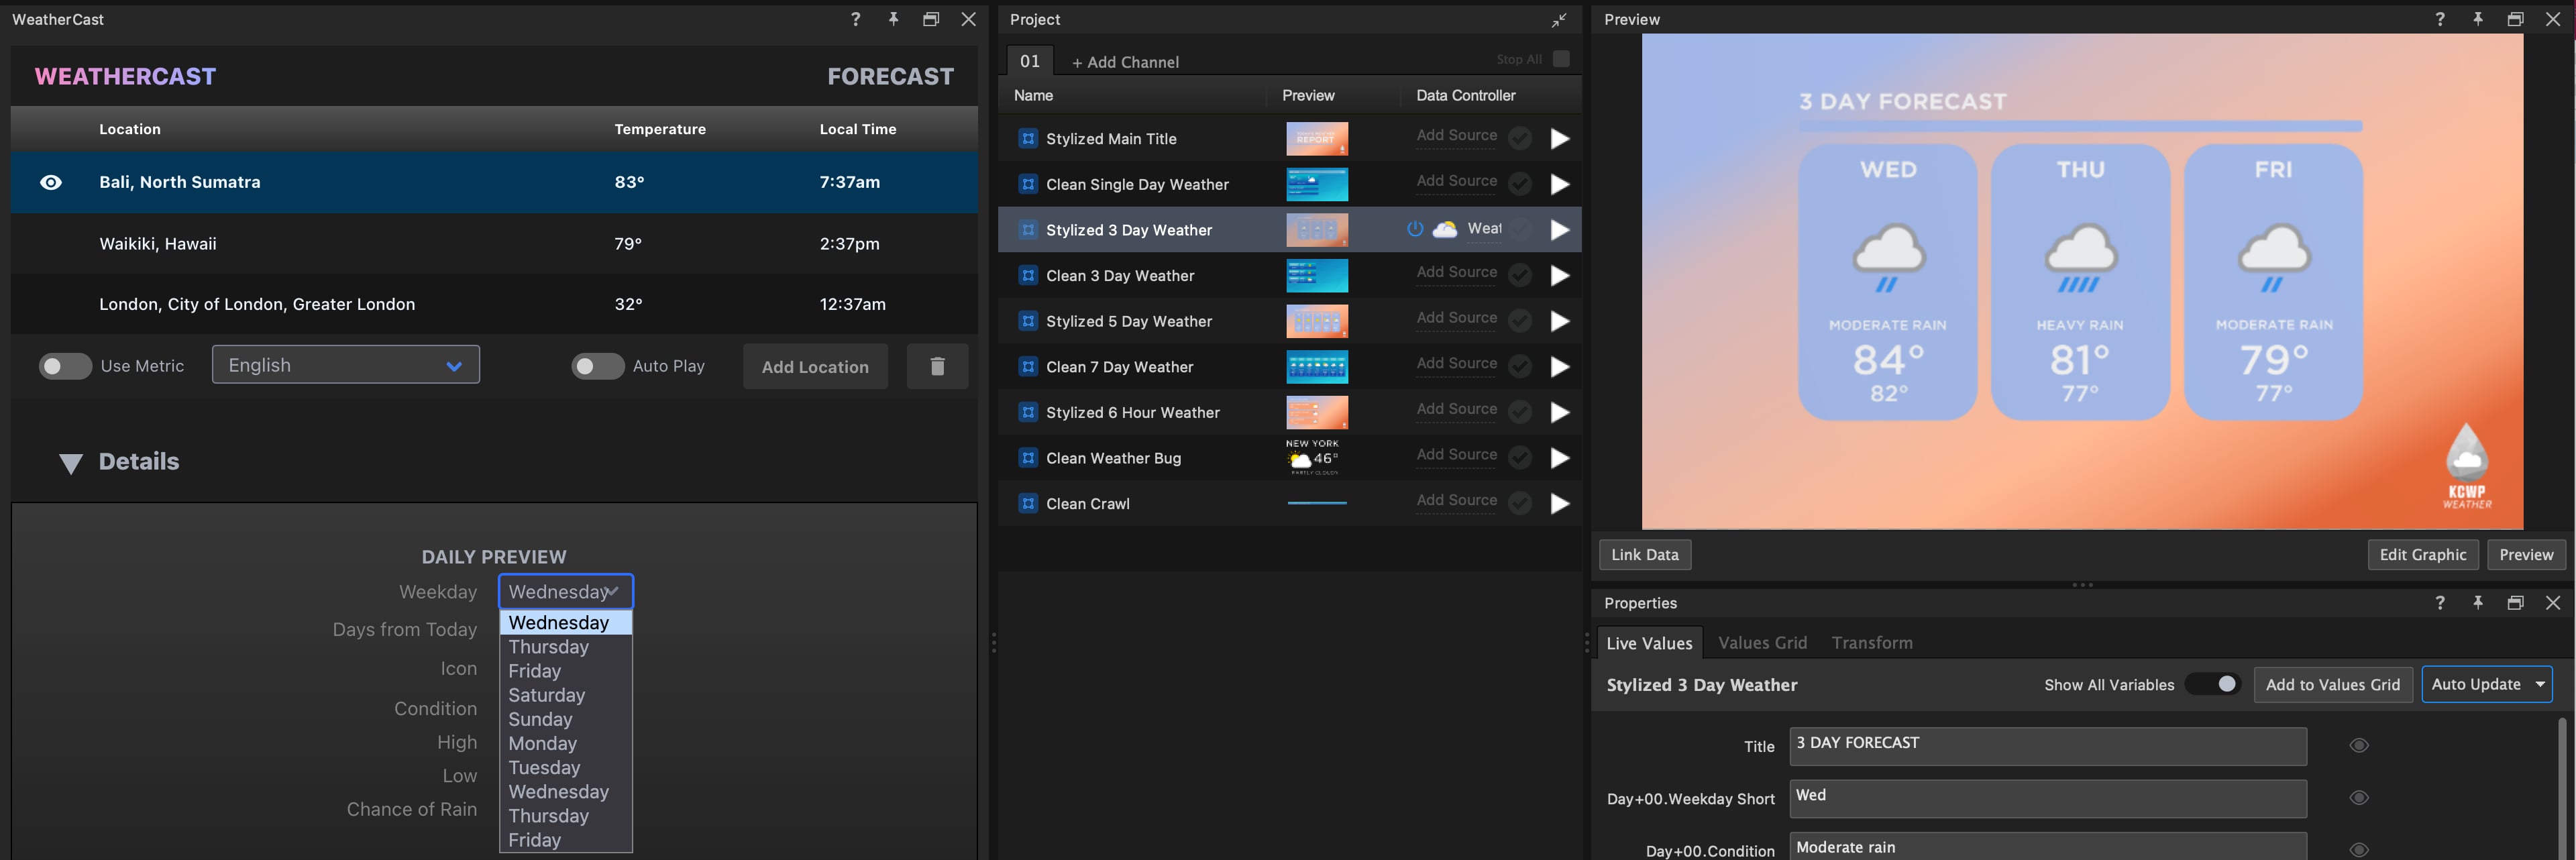
8. In the WeatherCast panel, select the first weekday you would like to showcase to populate in your graphic.
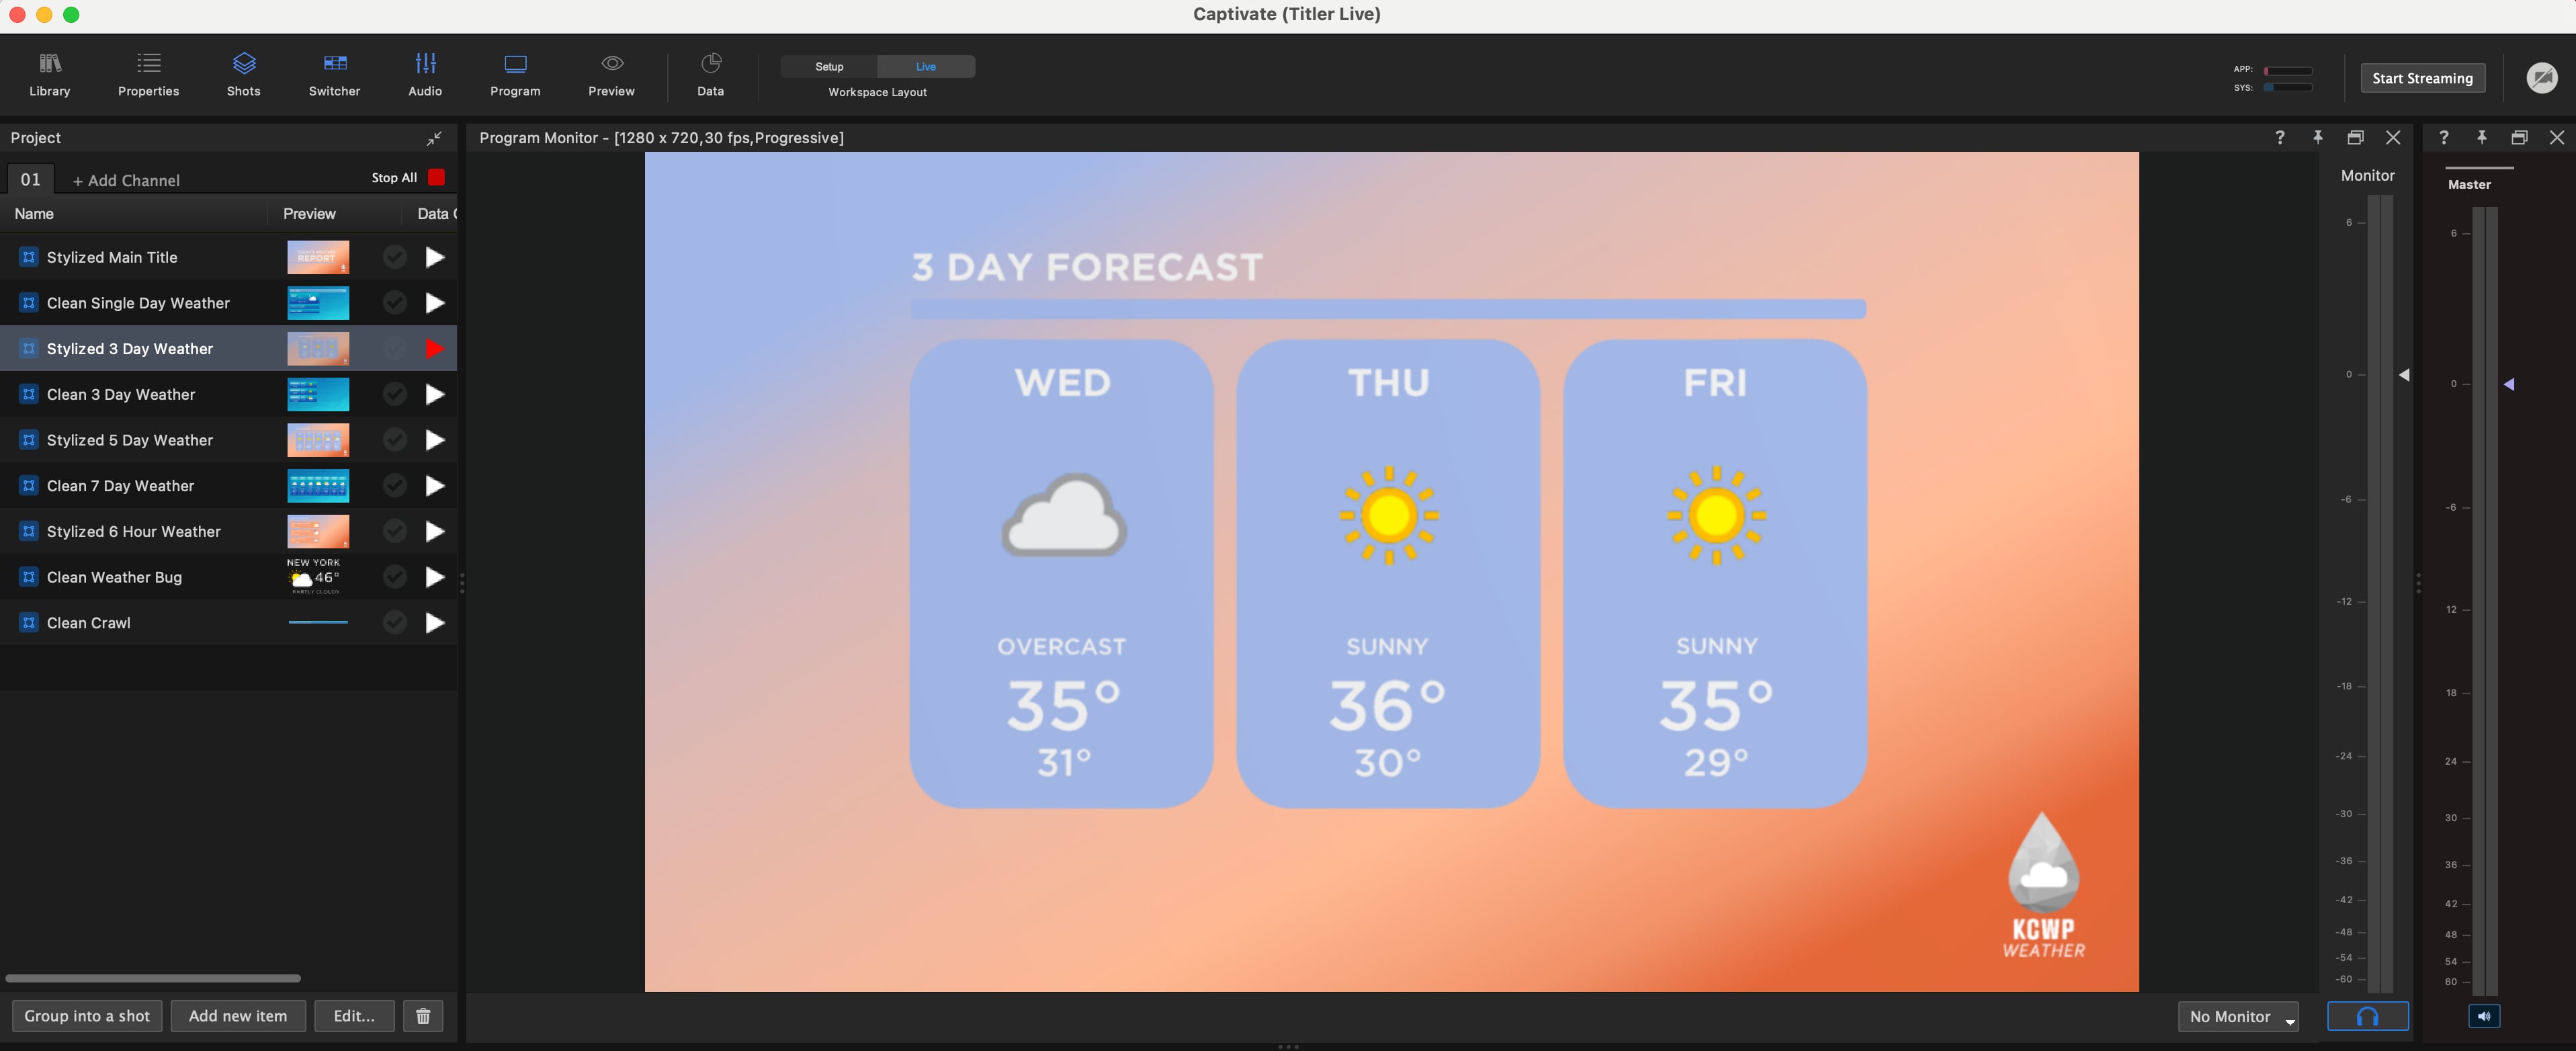
The data in your WeatherCast input should now be visible in your graphic and updated in real time.
## Setting up a Multi-Hour Forecast
1. In Captivate’s playout interface, navigate to the Library > **Weather**. Drag and drop the **6 Hour Weather** graphic or another template of your choice into your Project List and select to highlight.
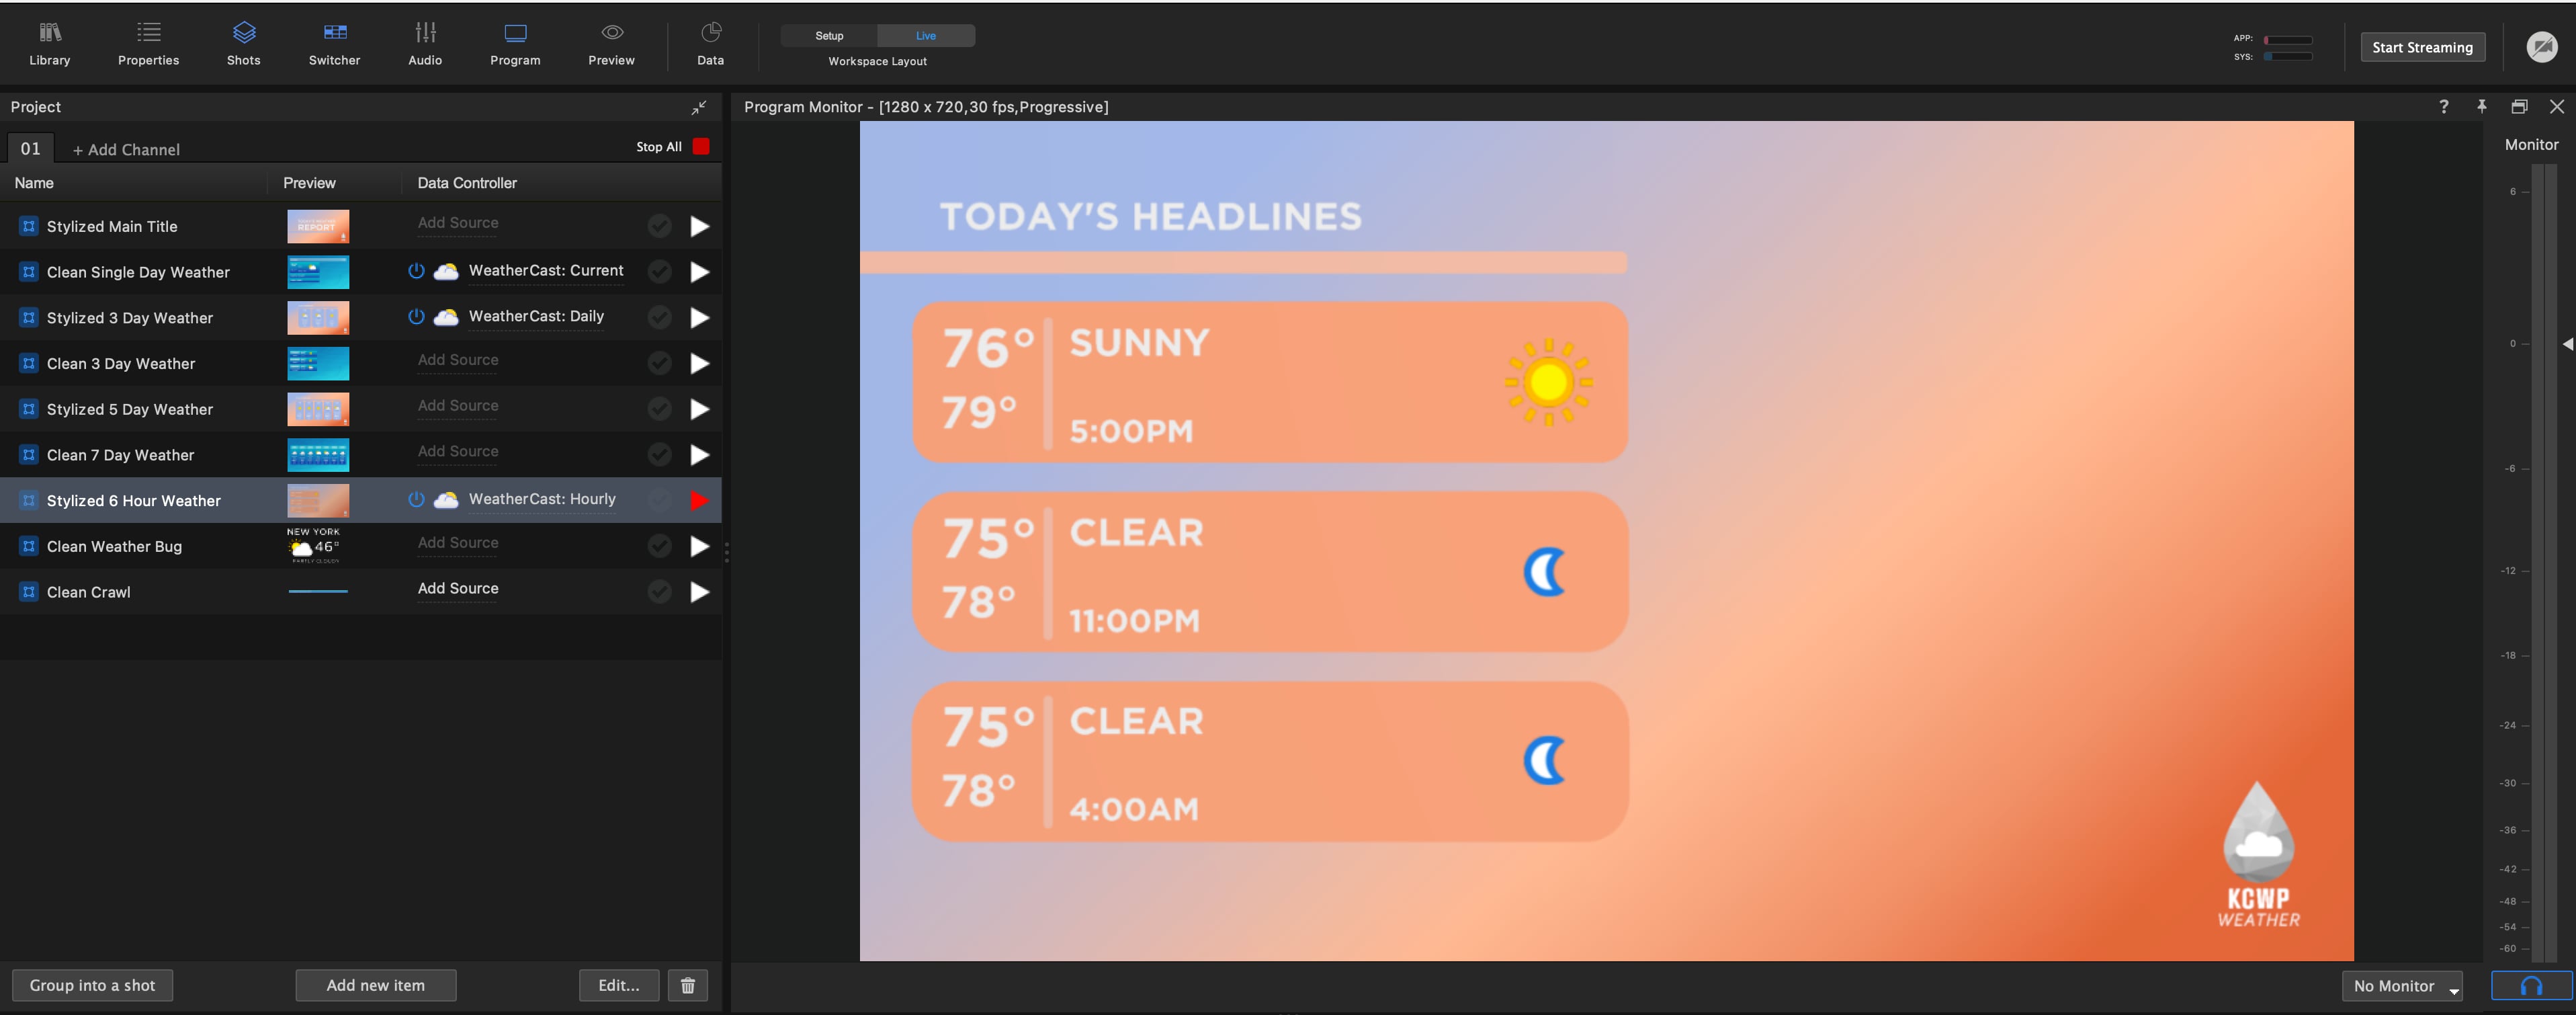
2. From the Project List, locate the Data Controller column. Select **Select a Datasource** > **Weather** > **WeatherCast** > **Hourly**.
3. The WeatherCast Data Controller will appear as a tab in the Layer Properties panel.
4. Select your desired language and click **Add Location**.
5. Type city, country, or zip code, select location, and click **Done**.
6. Click the **Link Data** button in the Preview panel.
7. Click and drag a WeatherCast variable onto an object in your graphic. Variables under **Hour+00** are for the current hour, **Hour+01** for 1 hour from current, **Hour+02** for 2 hours from current, etc.
For the hourly weather display, the variables available include:
* Condition
* Temperature
* Chance of Rain
* Cloud
* Feels Like
* Hour
* Humidity
* Icon
* Is Day
* Is Night
* Precipitation
* Pressure
* Time
* UV
* Visibility
* Weekday
* Wind
The data in your WeatherCast input should now be visible in your graphic and updated in real time.
## Showcasing Multiple Locations
1. Repeat steps 1–4 for any of the desired Current, Daily, or Hourly graphic displays as described in the previous sections.
2. Type city, country, or zip code of your desired location, select location, click **Return**, repeat for the amount of locations desired, then click **Done**.
3. Continue with the remaining steps as described in the previous sections.
4. When complete, select each city in the WeatherCast panel that you would like to be displayed. You also have the option to toggle on **Auto Play** and set the desired amount of seconds to display the data for each location.
The data in your WeatherCast input should now be visible in your graphic and updated in real time.
## Behavior notes
* **Hourly** exposes 12 hours by default; **Daily** exposes 10 days by default.
* When a graphic with a Crawl or Roll conductor is bound to a WeatherCast input, the **Auto Play** control is replaced with **Auto Plays with \** — the conductor drives the cadence.
* Only one open WeatherCast instance is the "controlling" instance at a time. Other open instances show a **Request Control** banner; click it to take control and let the previous controller release.
---
# Agent Instructions
This documentation is published with GitBook. GitBook is the documentation platform designed so that both humans and AI agents can read, navigate, and reason over technical content effectively. Learn more at gitbook.com.
## Querying This Documentation
If you need additional information that is not directly available in this page, you can query the documentation dynamically by asking a question.
Perform an HTTP GET request on the current page URL with the `ask` query parameter, and the optional `goal` query parameter:
```
GET https://captivatehelp.newbluelive.com/play-and-update-graphics/chapter-index-3/weather-controller.md?ask=&goal=
```
`ask` is the immediate question: it should be specific, self-contained, and written in natural language.
`goal` is optional and describes the broader end goal you are ultimately trying to accomplish on behalf of the user. GitBook uses it to tailor the answer towards what is most useful for that goal.
The response will contain a direct answer to the question and relevant excerpts and sources from the documentation.
Use this mechanism when the answer is not explicitly present in the current page, you need clarification or additional context, or you want to retrieve related documentation sections.