> For the complete documentation index, see [llms.txt](https://captivatehelp.newbluelive.com/llms.txt). Markdown versions of documentation pages are available by appending `.md` to page URLs; this page is available as [Markdown](https://captivatehelp.newbluelive.com/play-and-update-graphics/chapter-index-3/how-data-controllers-work.md).
# How Data Controllers work
A Data Controller is a Captivate component that fetches live data from a specific source and delivers it to your graphics. Pick a graphic, pick a Data Controller, and Captivate keeps the graphic in sync with the source: no manual entry, no copy-paste, no scripting.
This page explains what a Data Controller is, when to use one (versus [Tables](/play-and-update-graphics/chapter-index-1/tables-overview.md)), and the operations that work the same way across the entire catalog. Read it once before wiring up a specific Data Controller; every catalog page assumes you’ve read this.
## When to reach for a Data Controller (not Tables)
Captivate offers two ways to drive a graphic with live data: Tables and Data Controllers.
* [Tables](/play-and-update-graphics/chapter-index-1/tables-overview.md) reads structured data from a file you provide: CSV, XML, JSON, Excel, Google Sheets. Use Tables when you own the data and can express it as rows and columns.
* **Data Controllers** connect to a source that actively produces data: a scoreboard on the field, a presentation app running next door, a weather service on the internet, a Zoom meeting in progress. Use a Data Controller when the source owns the data and you need to follow it in real time.
The line is "where does the data live?" If it lives in a file you maintain, Tables. If it lives in a system that’s already running, a Data Controller.
## The shape of a Data Controller
Every Data Controller in the catalog follows the same pattern:
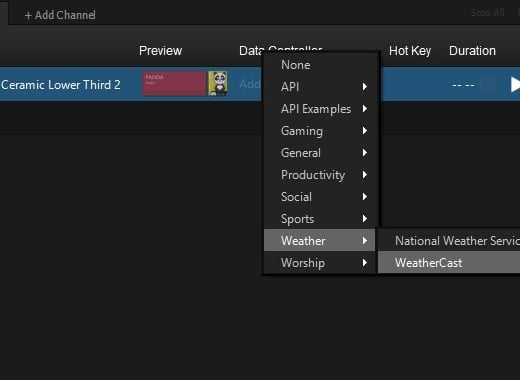
1. **You select it** from the **Data Controller** column drop-down on a graphic in your Project List.
2. **It opens a configuration panel** with the inputs it needs: a hostname, a credential, a sport selection, a meeting ID. Every Data Controller’s panel is custom to its source, but the shape is the same: enter the connection details, validate the connection, you’re done.
3. **It auto-links to a matching graphic** where possible. If you add a basketball scoreboard Data Controller to a basketball graphic from the Library’s **Inputs** section, the variables already line up.
4. **It runs in the background** once configured. You play the graphic on, the Program Monitor shows it, and the Data Controller pushes updates as the source changes.
## Operations that work the same across the catalog
These are the operations you’ll perform with every Data Controller, so they’re worth learning once.
### Select a Data Controller
In the Project List, find the **Data Controller** column for your graphic and click the drop-down. Data Controllers are grouped by category (API, Gaming, General, Productivity, Social, Sports, Weather, Worship, plus API Examples for sample handlers) and listed by source. Select the one you need; its configuration panel opens automatically.
### Link Data — remap which Data Controller variable drives which graphic variable
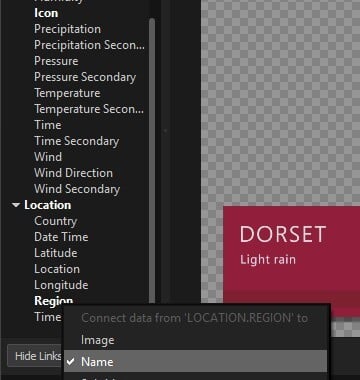
Auto-linking handles the common case (basketball Data Controller into basketball graphic). When the variables don’t line up automatically (a soccer scoreboard with a generic lower third, or a custom design with non-standard variable names), open **Link Data** on the left side of the Preview. Captivate shows the Data Controller’s available variables on one side and the graphic’s variables on the other; drag to connect them. The graphic updates live as you wire each link.
### Manage credentials — the Service Accounts panel
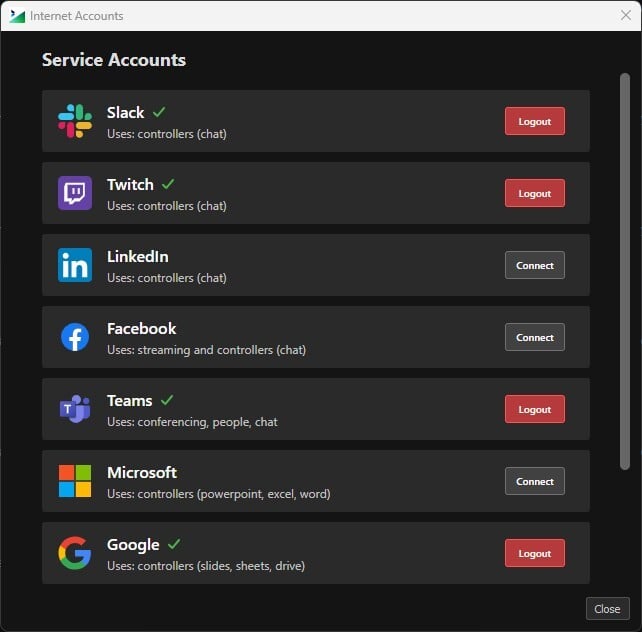
Data Controllers that talk to third-party services (Zoom, Microsoft Teams, Google, Slack, Twitch, Facebook, LinkedIn, YouTube) need to authenticate. Captivate centralizes credential management in one place so you authenticate once and every Data Controller that needs that account just works.
The menu path is **Internet Accounts**; the panel that opens is the **Service Accounts panel**. The two names refer to the same surface: **Internet Accounts** is how you get there, and **Service Accounts** is what you see at the top of the panel once it’s open. Authenticate each service here, and every Data Controller that uses it picks the credentials up automatically.
For the step-by-step procedure, see [Authenticate your internet accounts](/play-and-update-graphics/chapter-index-3/authenticate-your-internet-accounts.md).
The same panel also holds shared, persistent accounts at the project level (a venue’s organizational Zoom account, a worship team’s shared ProPresenter login) for deployments that need credentials separate from the operator’s personal sign-in. Most operators don’t need this; it’s a setup-time tool.
## Find your Data Controller
Each Data Controller has its own page in the catalog with the specifics for its source: connection steps, what data it produces, how to handle source-specific failure modes. Open the catalog list in the navigation, or jump directly:
* [Weather](/play-and-update-graphics/chapter-index-3/weather-controller.md)
* [Sportzcast / Scorebot](/play-and-update-graphics/chapter-index-3/connect-sportzcast.md)
* [StatCrew](/play-and-update-graphics/chapter-index-3/connect-statcrew.md)
* [ProPresenter](/play-and-update-graphics/chapter-index-3/connect-propresenter.md)
* [EasyWorship](/play-and-update-graphics/chapter-index-3/connect-easyworship.md)
* [Zoom Meeting](/play-and-update-graphics/chapter-index-3/connect-zoom-meeting.md)
* [Social Chat](/play-and-update-graphics/chapter-index-3/social-chat-controller.md)
## Next step
If you have not yet wired any data into a graphic, start with the step-by-step path: [5. Drive a graphic with a Data Controller](/play-and-update-graphics/chapter-index/5-drive-with-data-controller.md) walks through one complete setup end-to-end, then sends you back here to pick your specific source.
## Related
* [Tables overview](/play-and-update-graphics/chapter-index-1/tables-overview.md) — the data-in-a-file alternative
* [Authenticate your internet accounts](/play-and-update-graphics/chapter-index-3/authenticate-your-internet-accounts.md)
* [Play and update graphics — section overview](/play-and-update-graphics/branch-index.md)
---
# Agent Instructions
This documentation is published with GitBook. GitBook is the documentation platform designed so that both humans and AI agents can read, navigate, and reason over technical content effectively. Learn more at gitbook.com.
## Querying This Documentation
If you need additional information that is not directly available in this page, you can query the documentation dynamically by asking a question.
Perform an HTTP GET request on the current page URL with the `ask` query parameter, and the optional `goal` query parameter:
```
GET https://captivatehelp.newbluelive.com/play-and-update-graphics/chapter-index-3/how-data-controllers-work.md?ask=&goal=
```
`ask` is the immediate question: it should be specific, self-contained, and written in natural language.
`goal` is optional and describes the broader end goal you are ultimately trying to accomplish on behalf of the user. GitBook uses it to tailor the answer towards what is most useful for that goal.
The response will contain a direct answer to the question and relevant excerpts and sources from the documentation.
Use this mechanism when the answer is not explicitly present in the current page, you need clarification or additional context, or you want to retrieve related documentation sections.