> For the complete documentation index, see [llms.txt](https://captivatehelp.newbluelive.com/llms.txt). Markdown versions of documentation pages are available by appending `.md` to page URLs; this page is available as [Markdown](https://captivatehelp.newbluelive.com/play-and-update-graphics/chapter-index-3/connect-statcrew.md).
# Connect Stat Crew statistical data to a graphic
Captivate can connect to the Stat Crew database and display incoming statistical data in graphics. Each sport in the menu offers about 20 per-graphic-shape entries (Game Open, Break Score, Lower Third, Top Players, Multiplayer 1/2/3, Player/Team Matchup, etc.), each binding a different variable set.
{% hint style="info" %}
This feature is not available in Captivate Present.
{% endhint %}
* [Single Player Stats](#single-player-stats)
* [Multiplayer Stats on the Same Team](#multiplayer-stats-on-the-same-team)
* [Comparing Stats from both Teams](#comparing-stats-from-both-teams)
## Single Player Stats
1. If you plan to use images in your graphic, ensure the following:
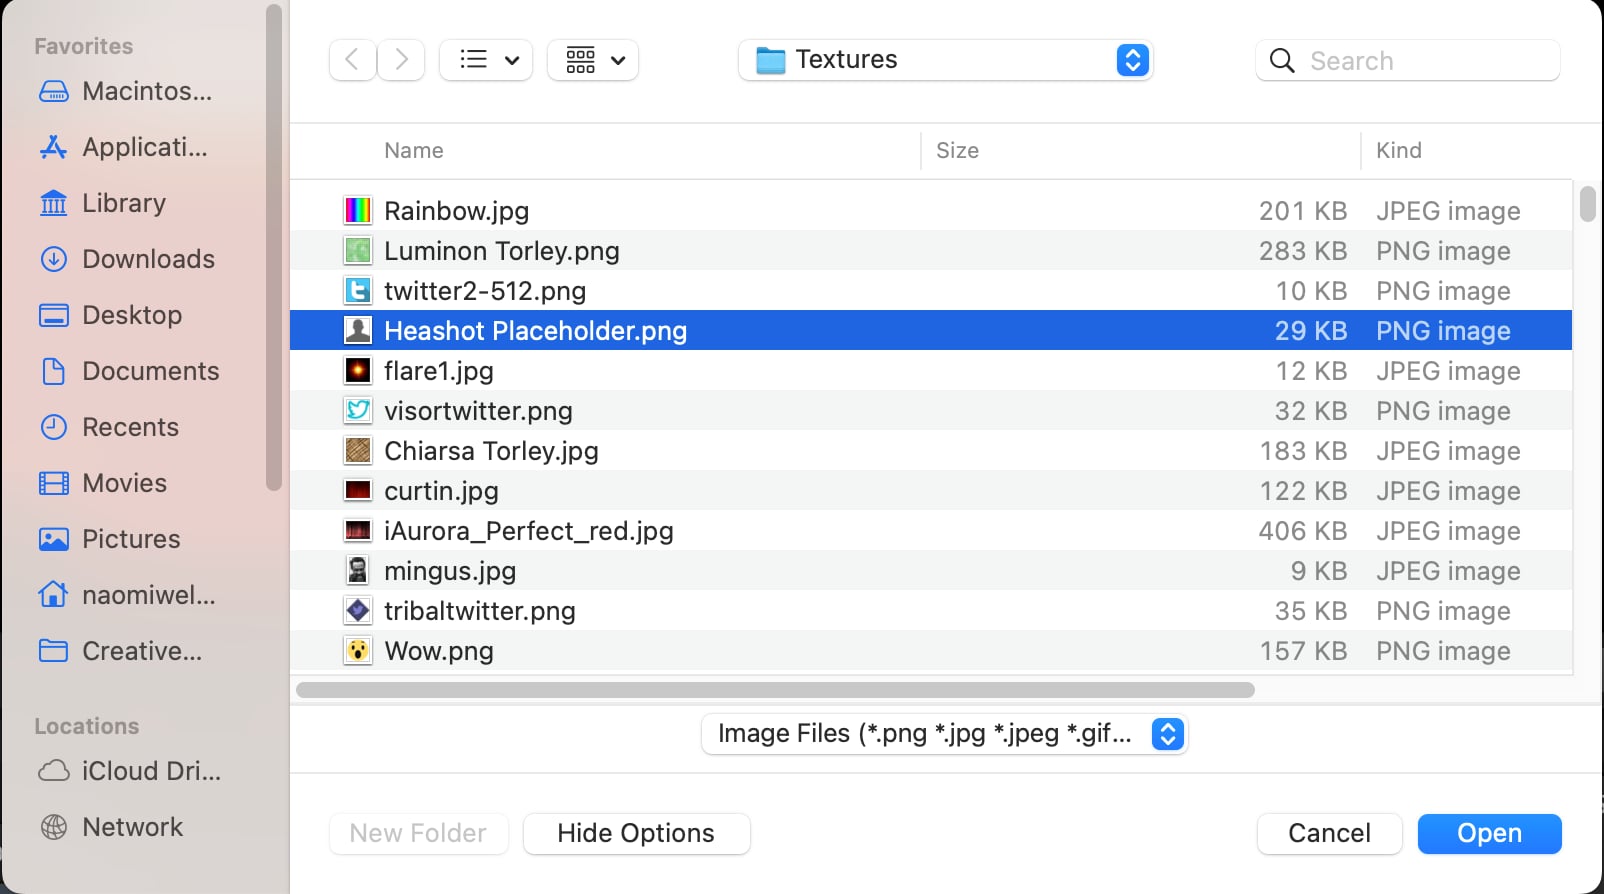
* Images live in a Textures folder next to the `nbtlproj` file. (Create the folder if absent.)
* Images are in that folder **before** opening the project file in Captivate.
* Images are named `lastnamefirstinitial.png`.
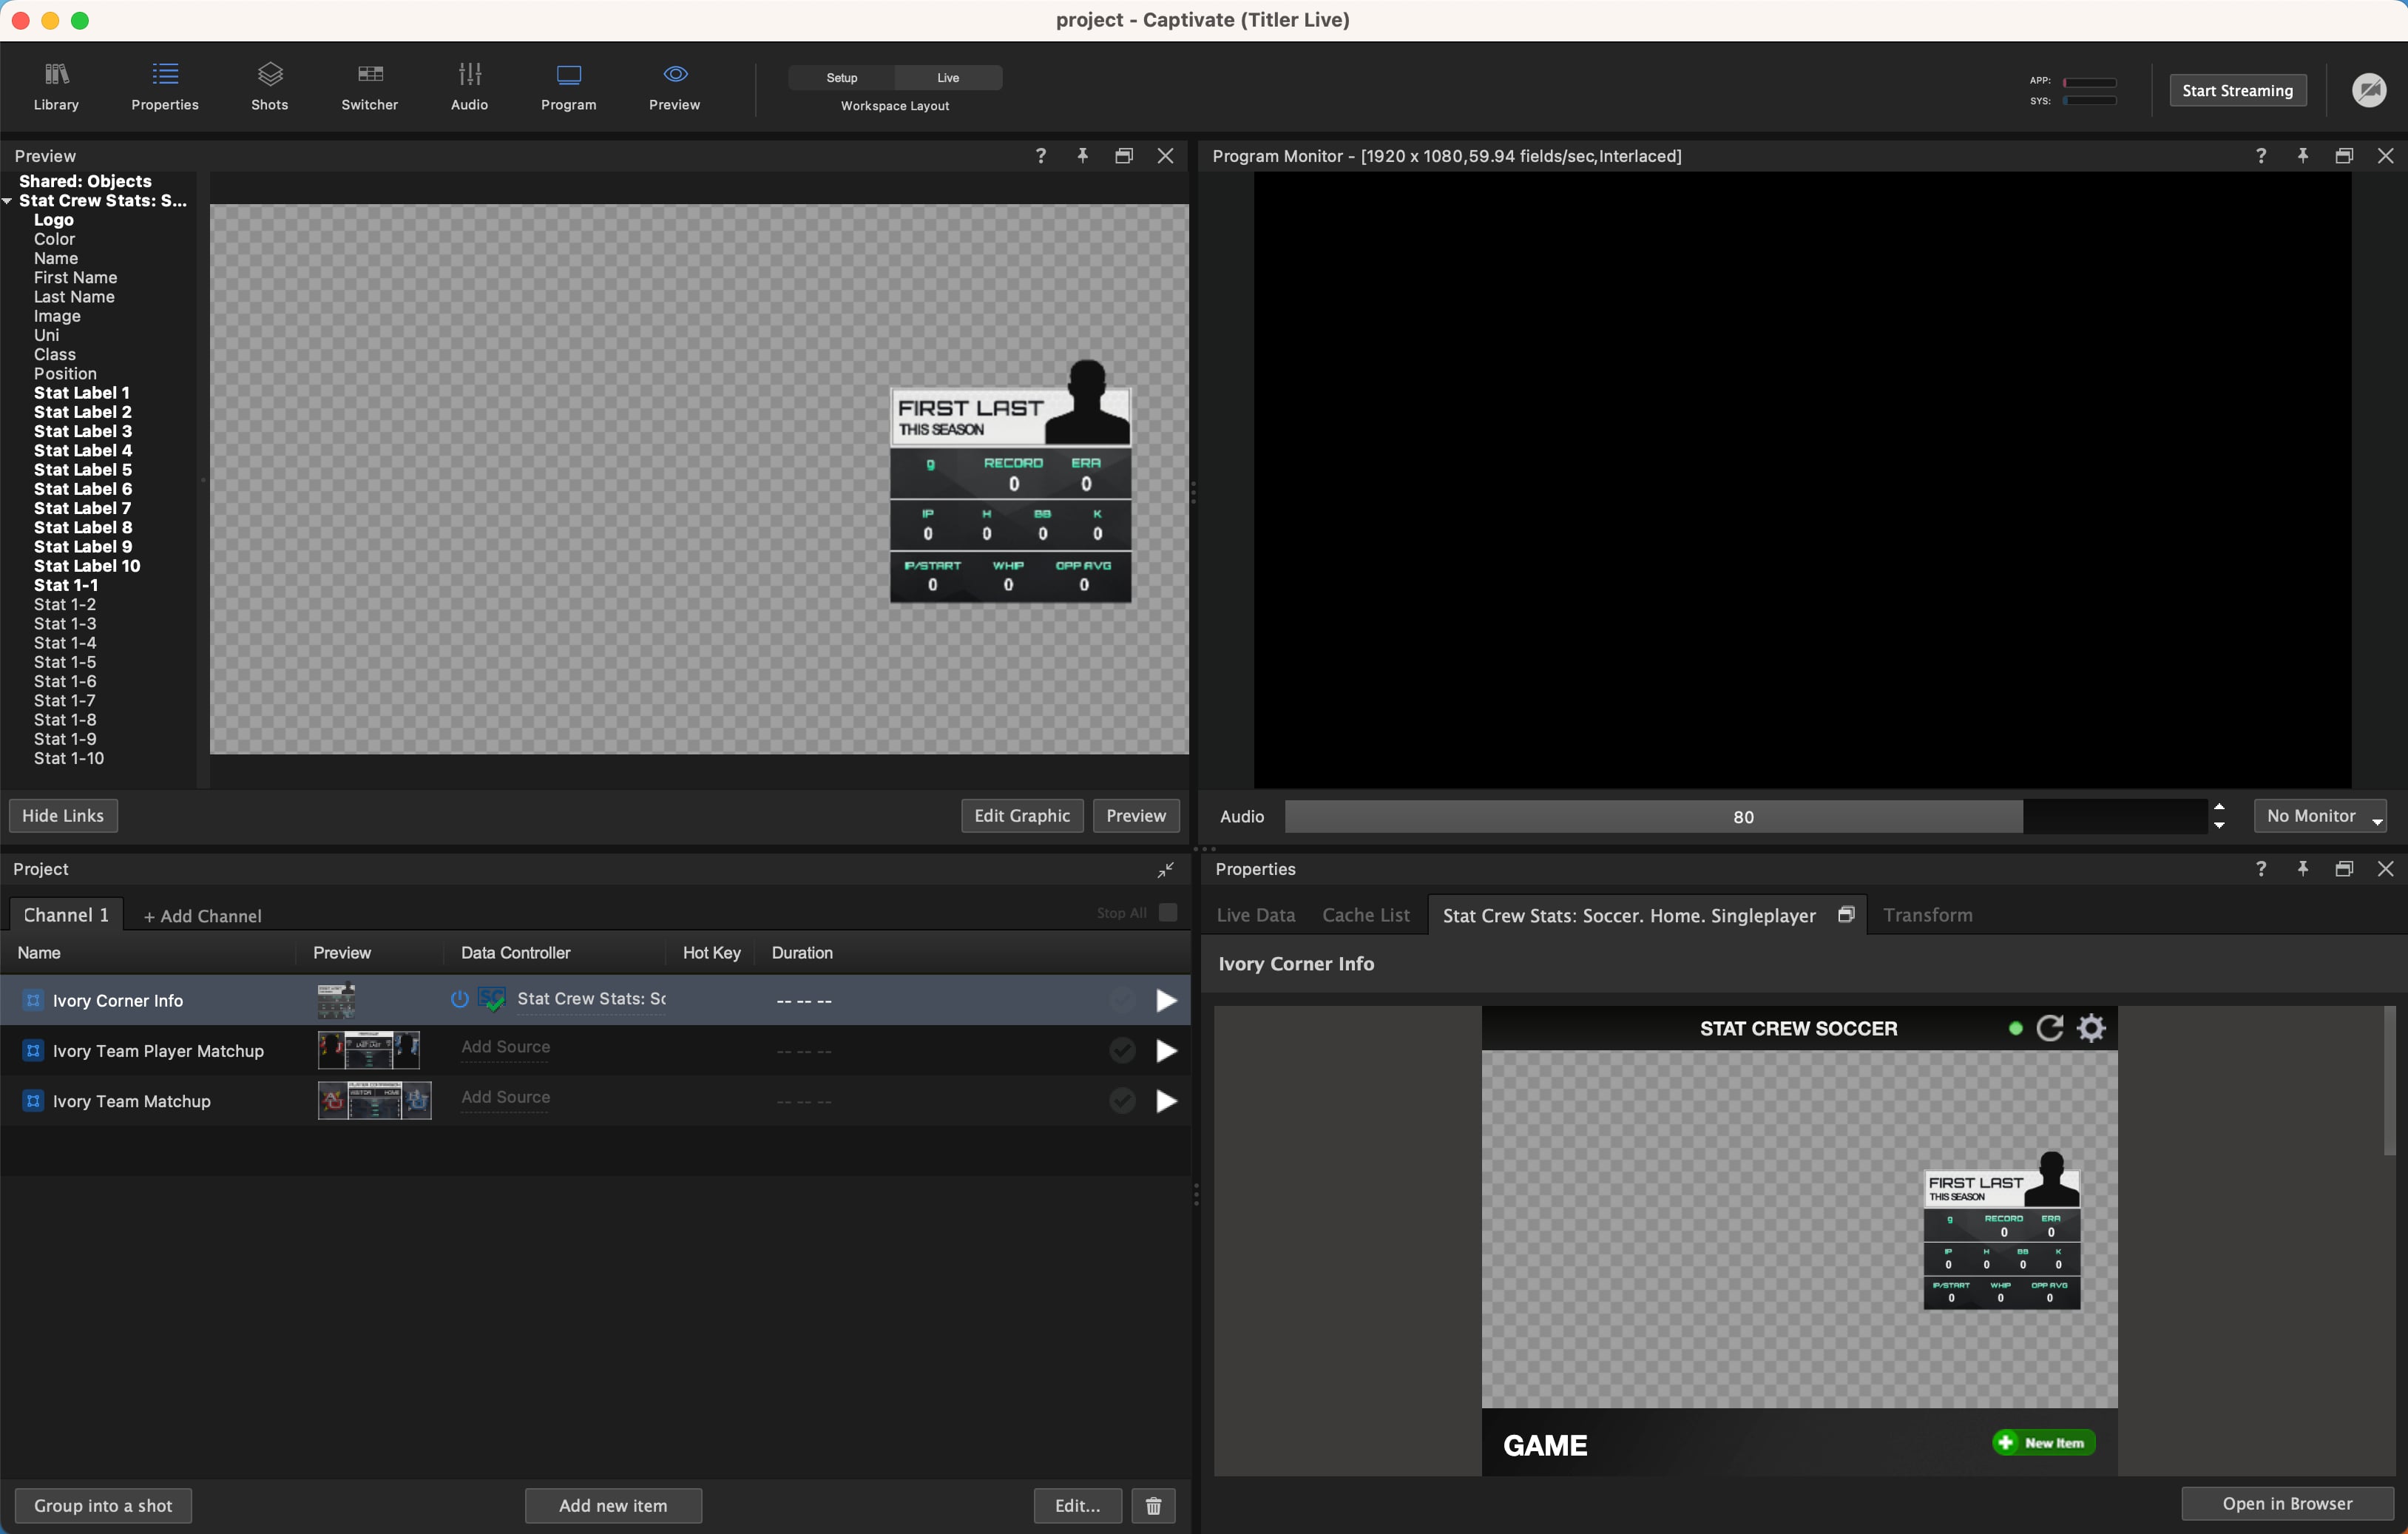
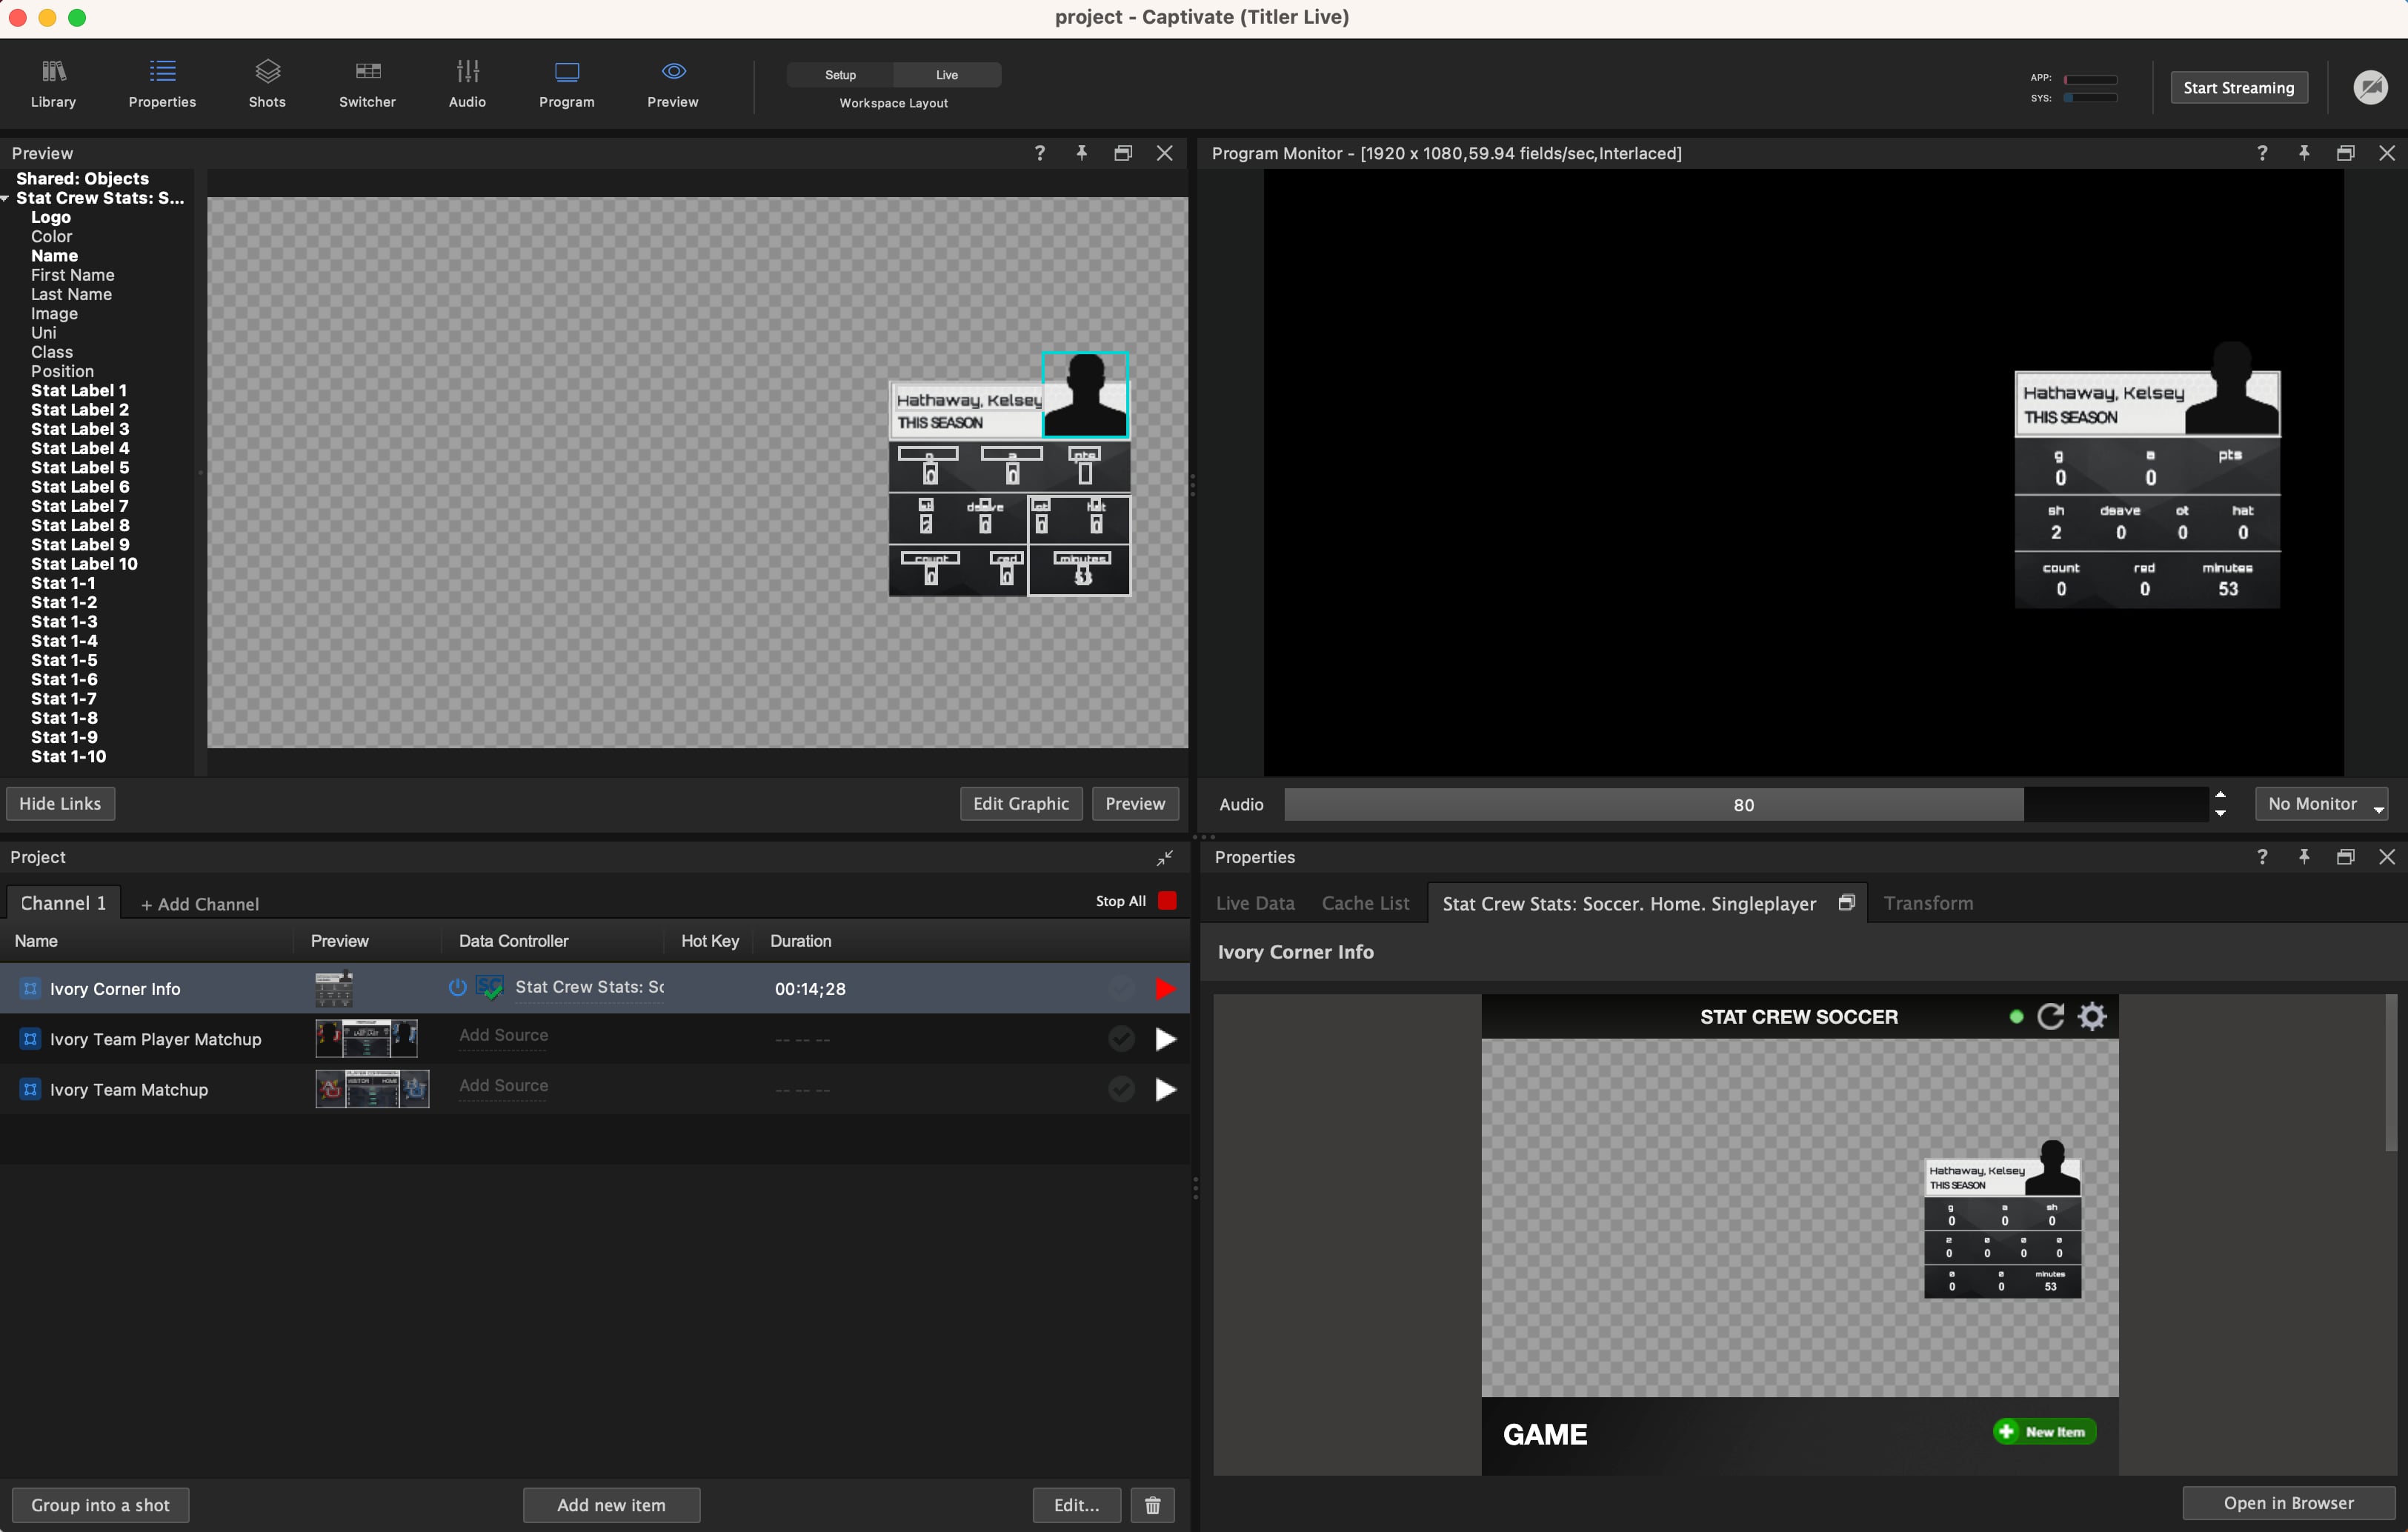
2. In Captivate’s playout interface, open a project (if one isn’t already open) and select a graphic in the Project List.
**💡 TIP**\
For best results, use a graphic that matches the name of the data controller template (e.g., Ivory Corner Info pairs with the Corner Info Stat template).
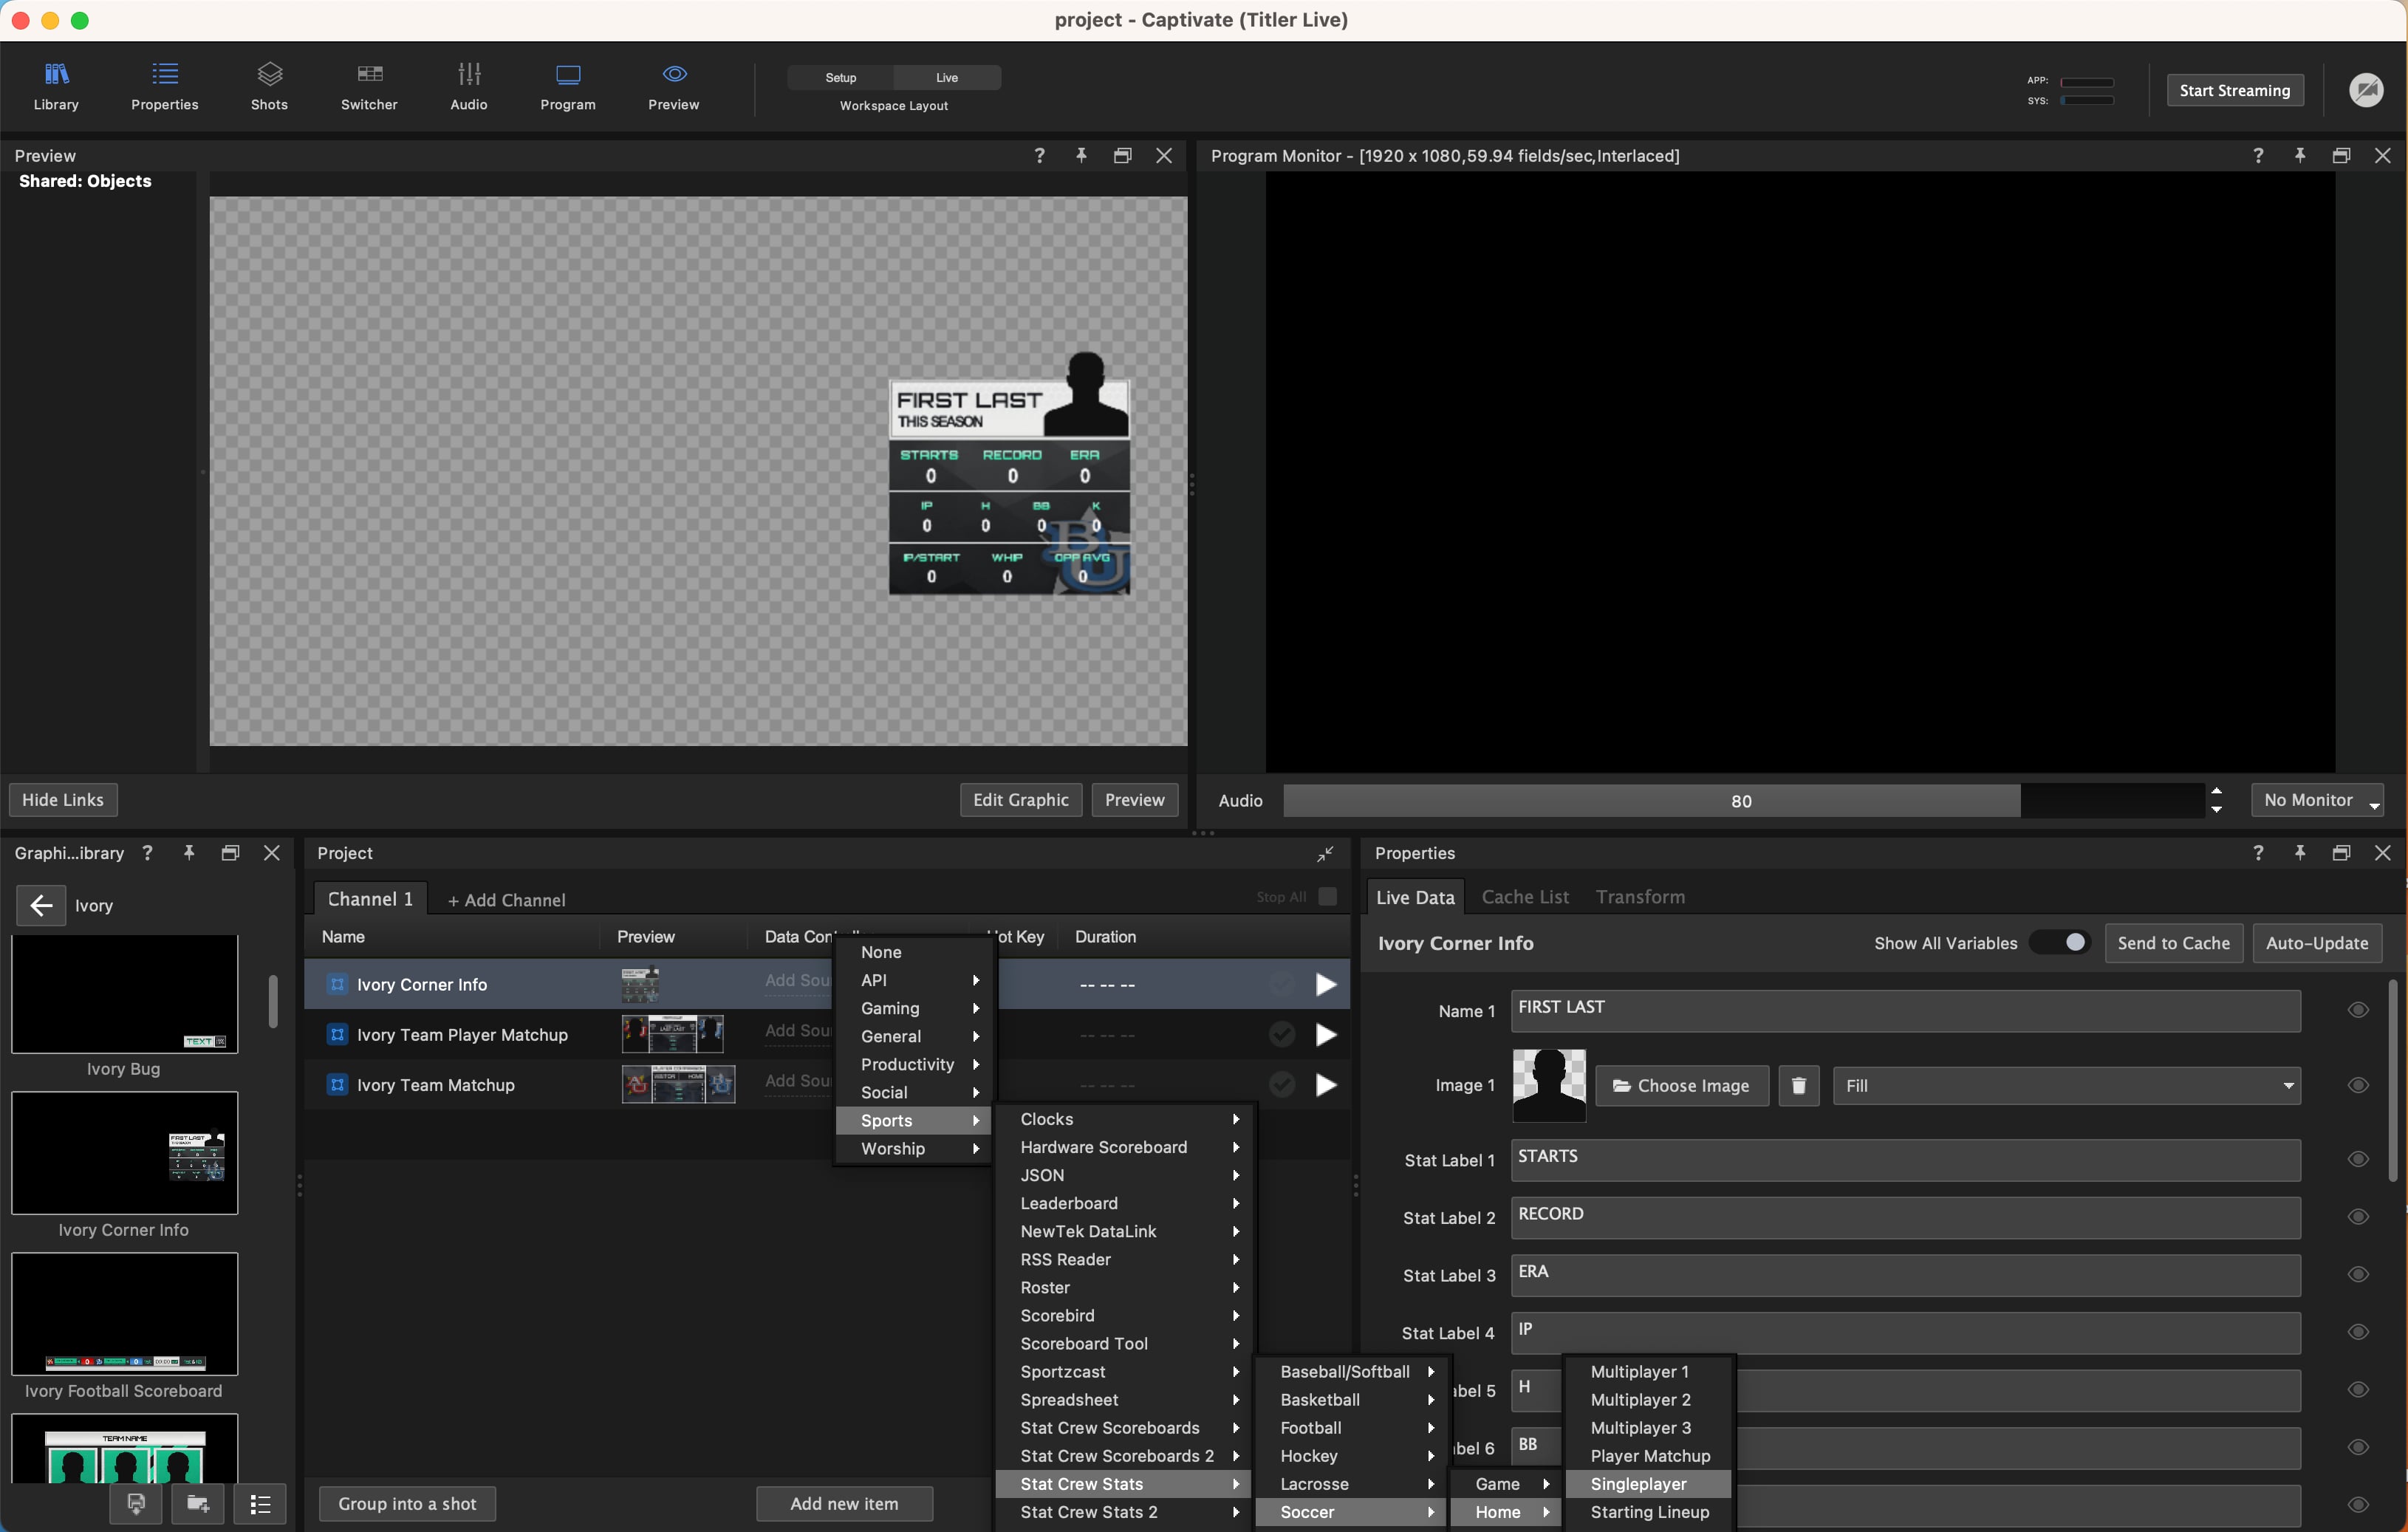
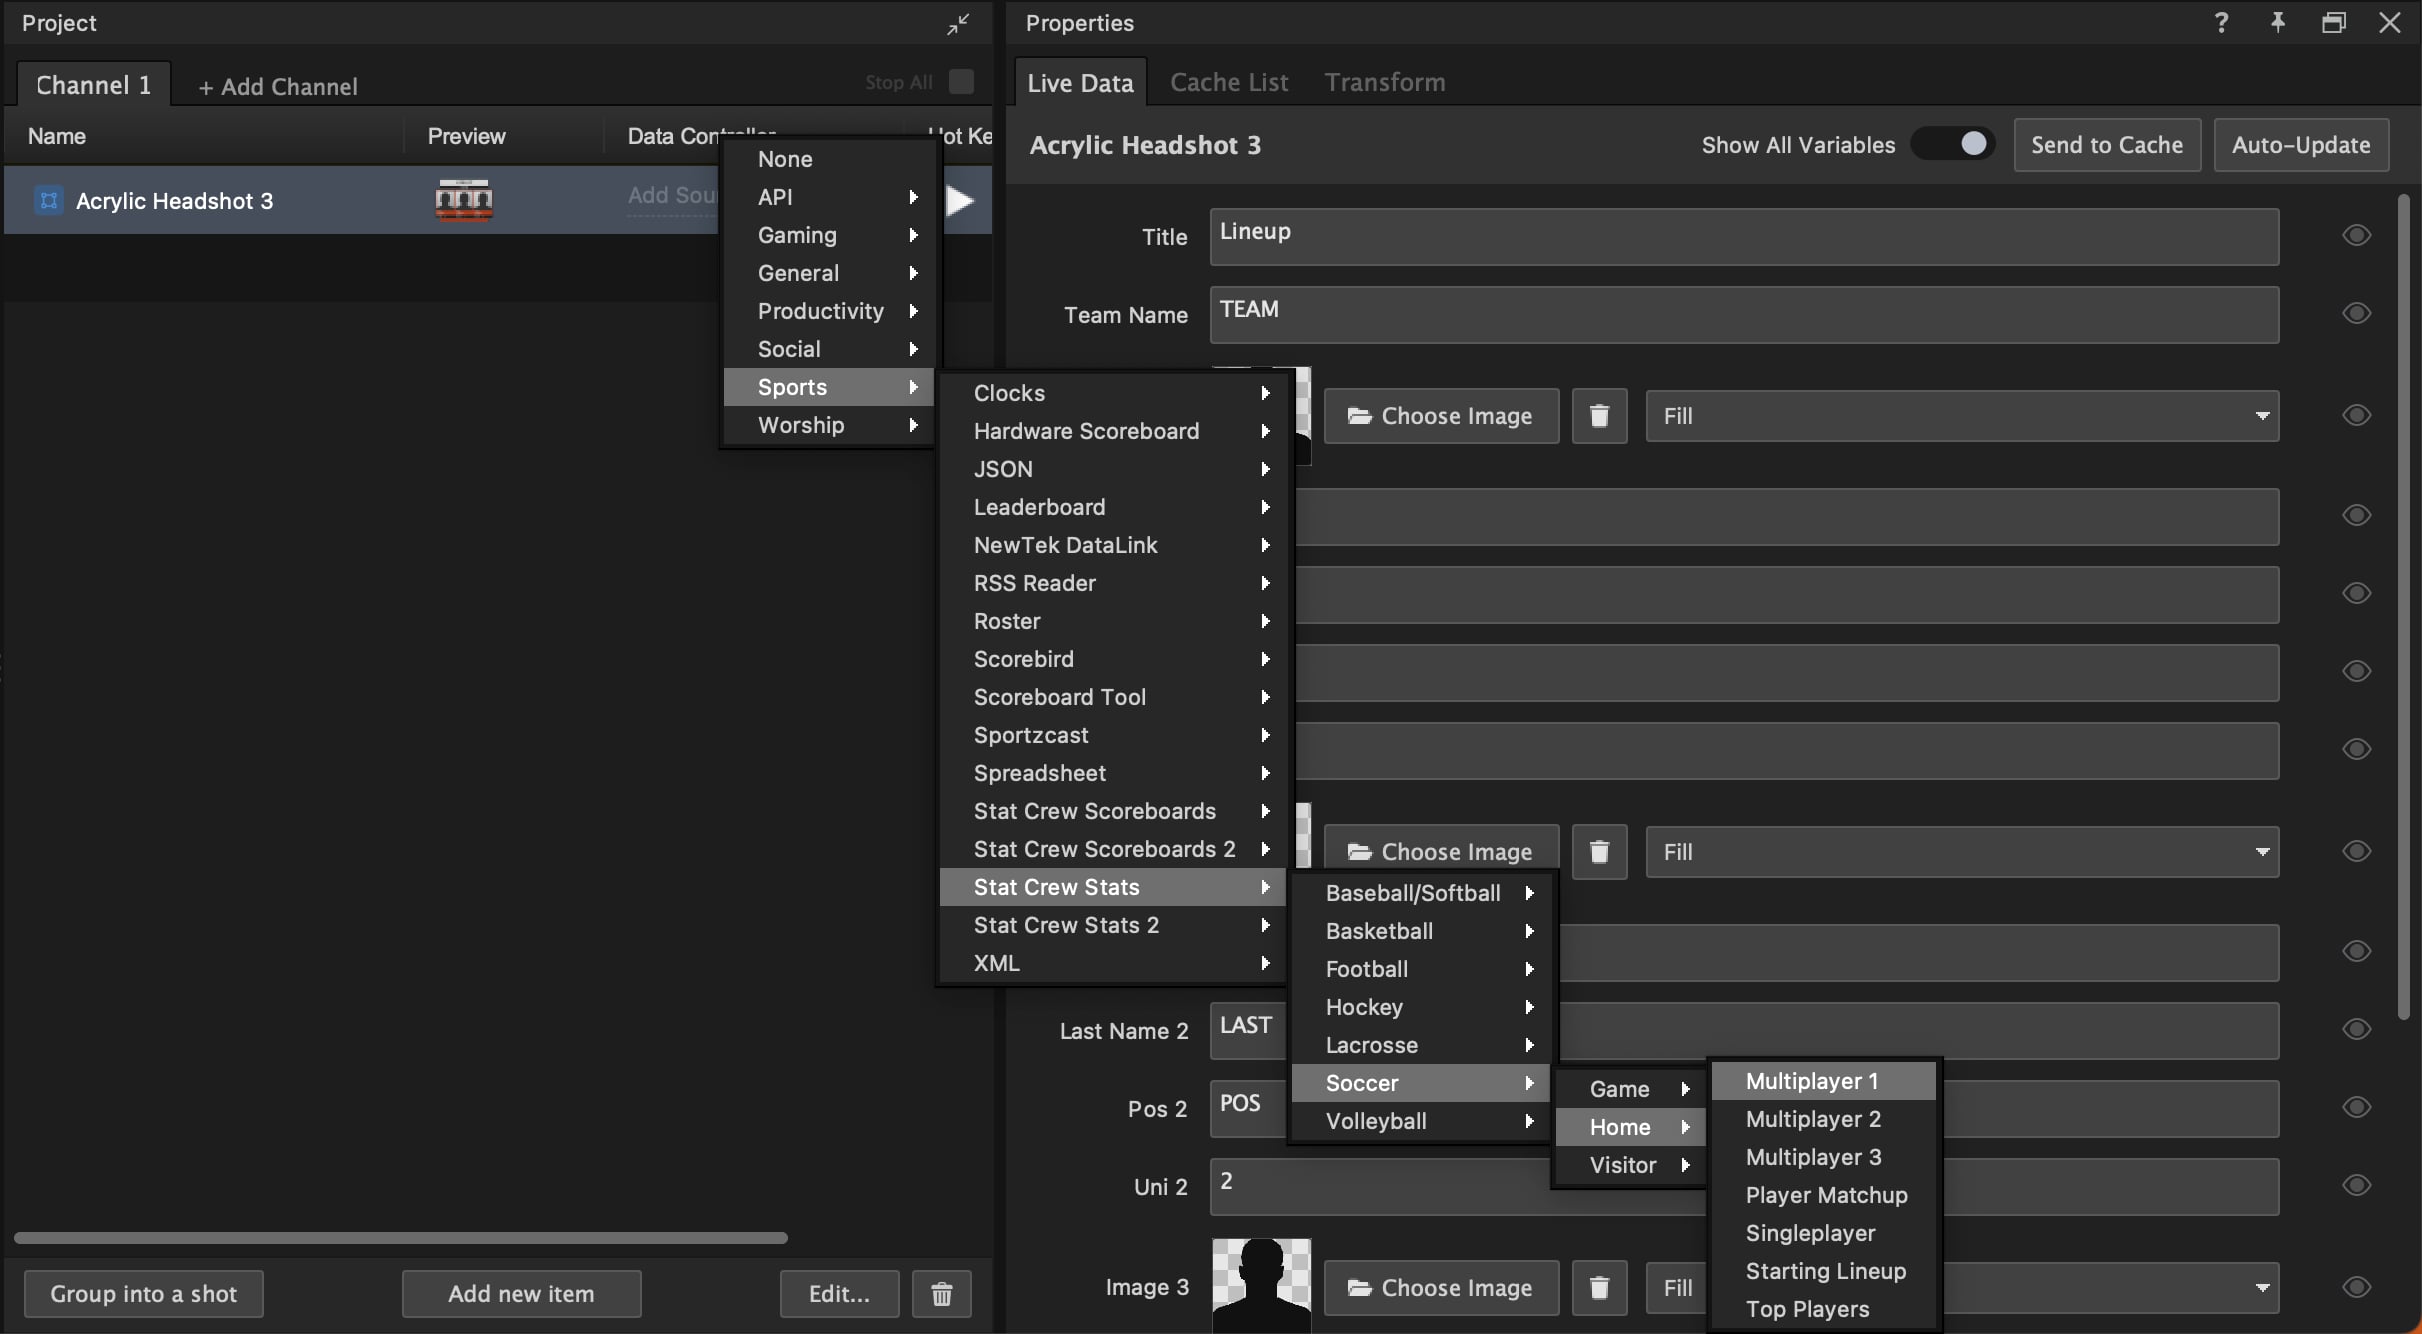
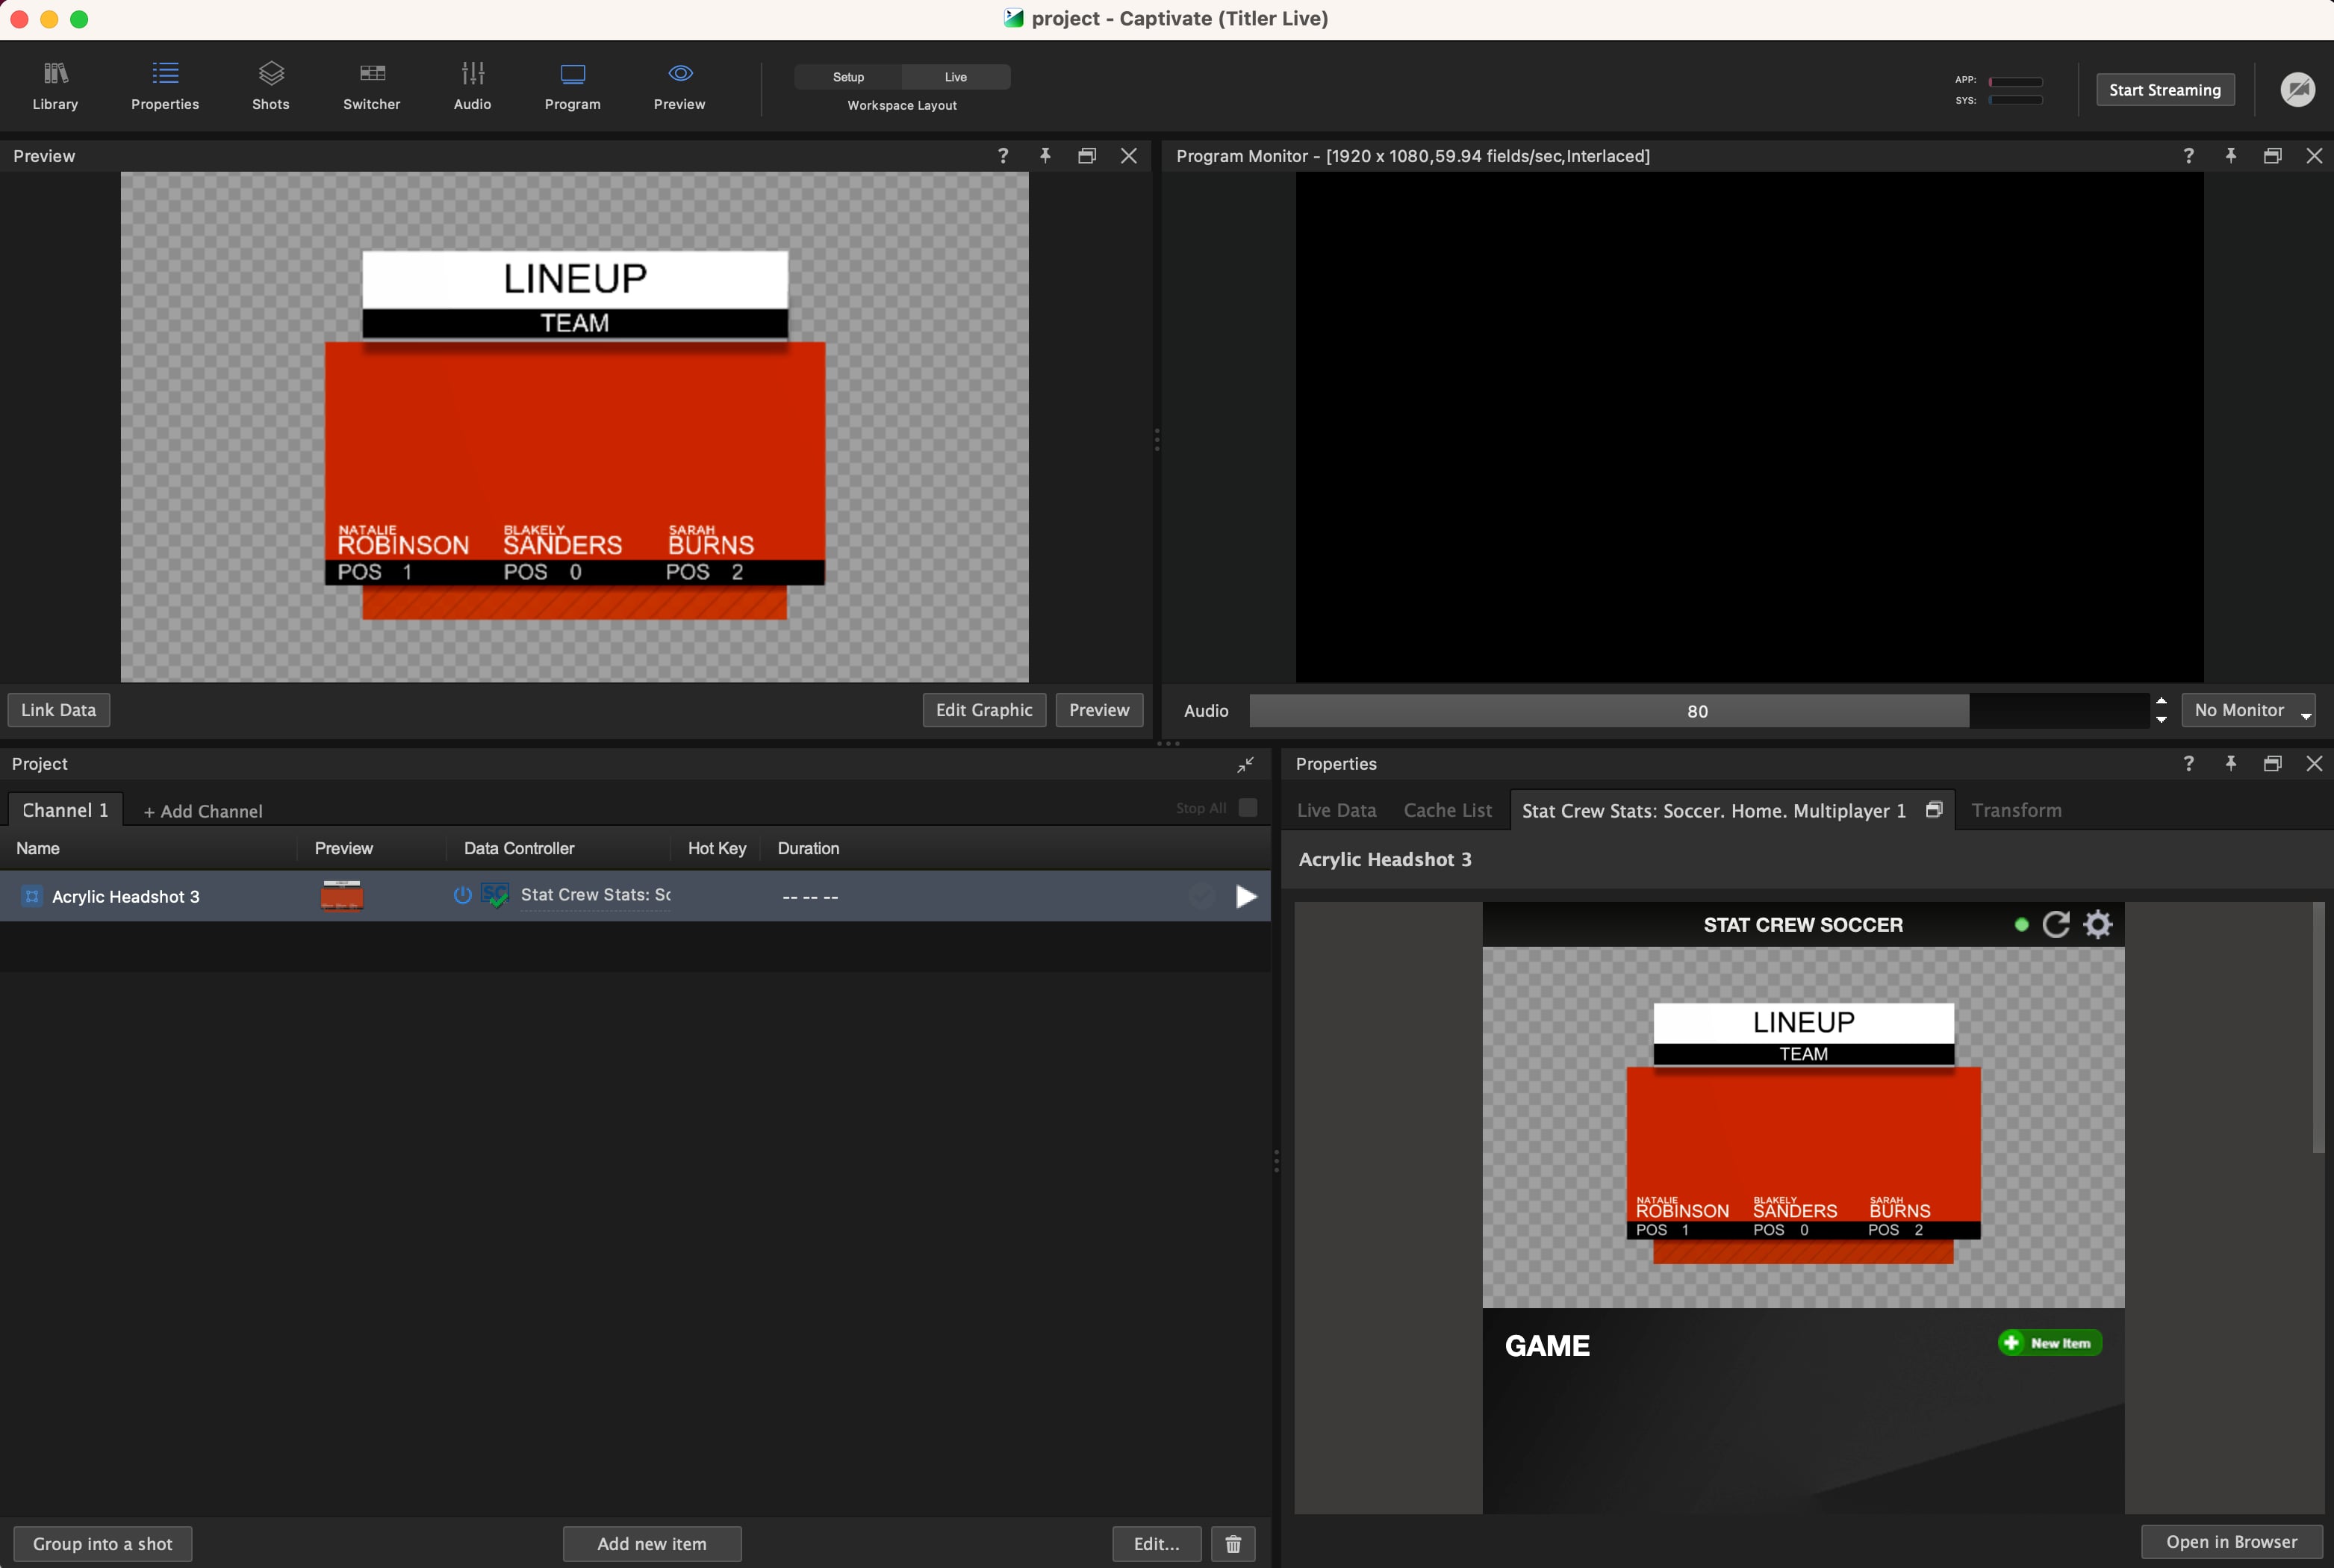
3. Under the Data Controller column, choose **Add source** > **Sports** > **Stat Crew Stats** and select a sport, team, and the type of data you want.
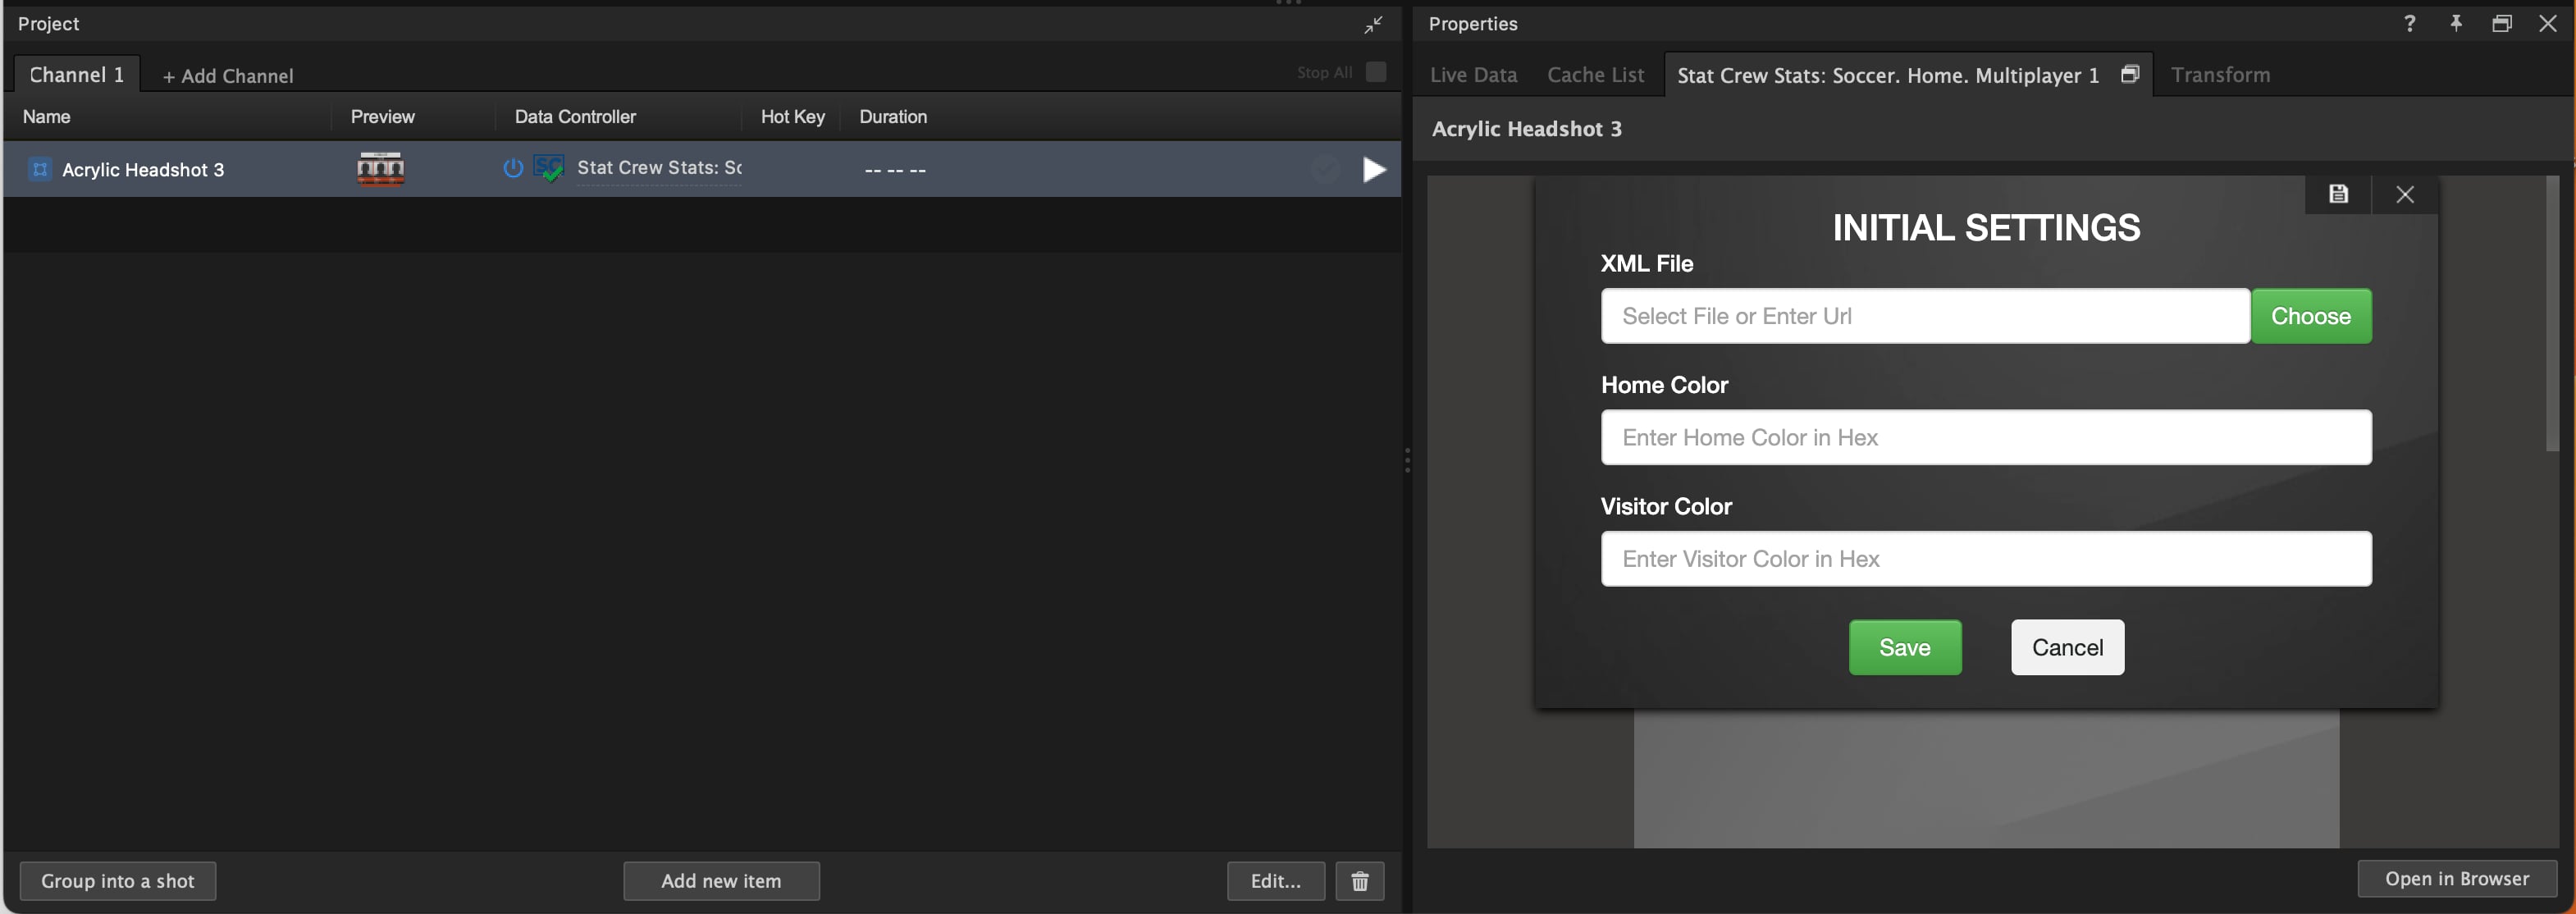
The data appears as a tab in the Layer Properties panel.
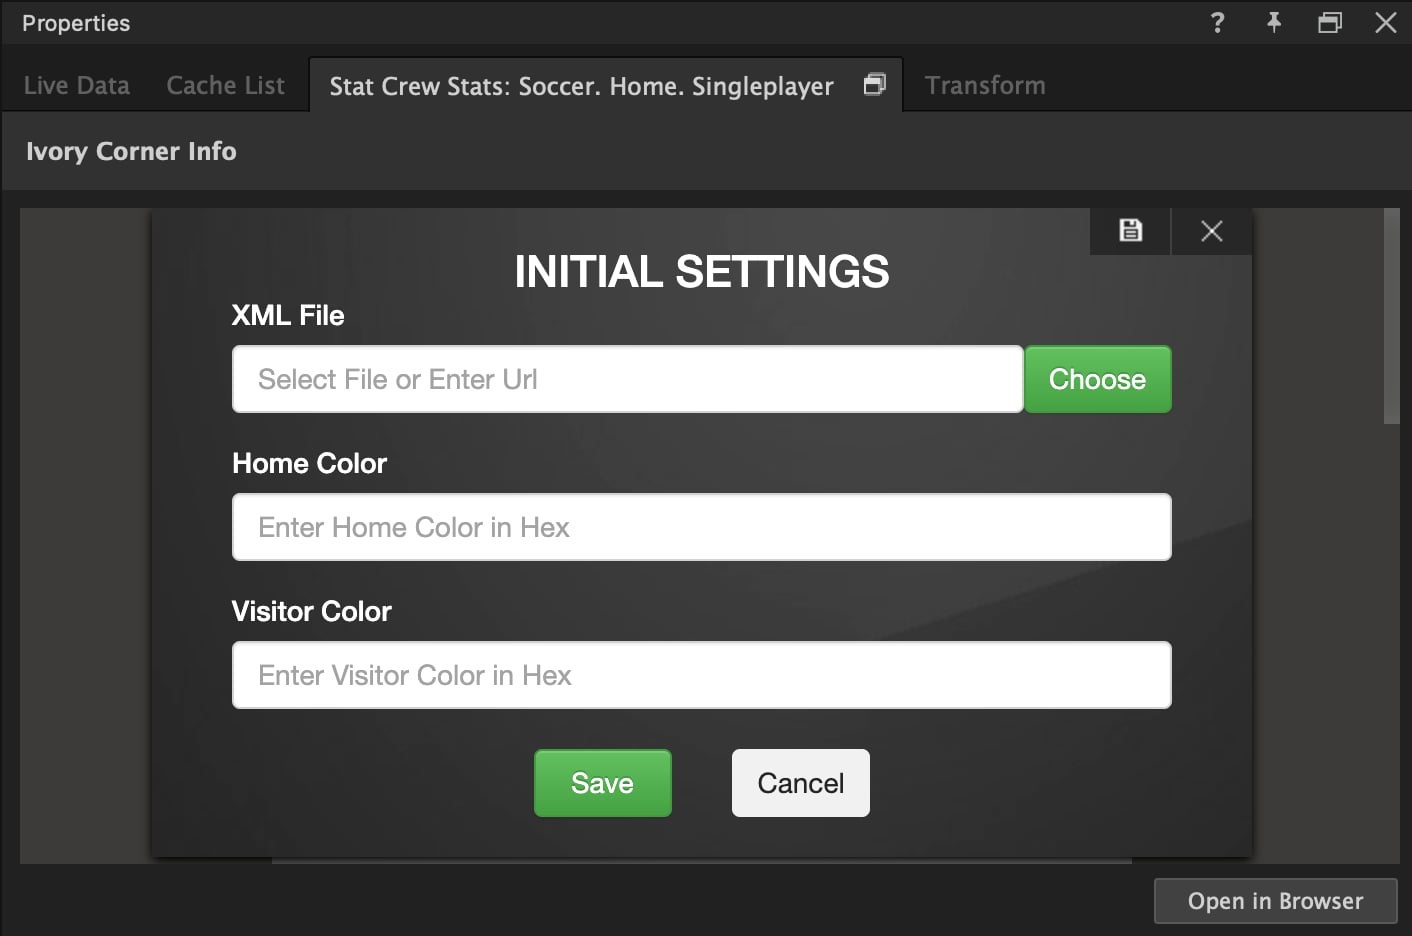
4. Navigate to the Stat Crew Stats controller tab and select your Stat Crew XML file or enter its path/URL. Browse to the file from your local disk if needed.
5. Enter the Hex codes for Home and Visitor team colors if desired and click **Save**.
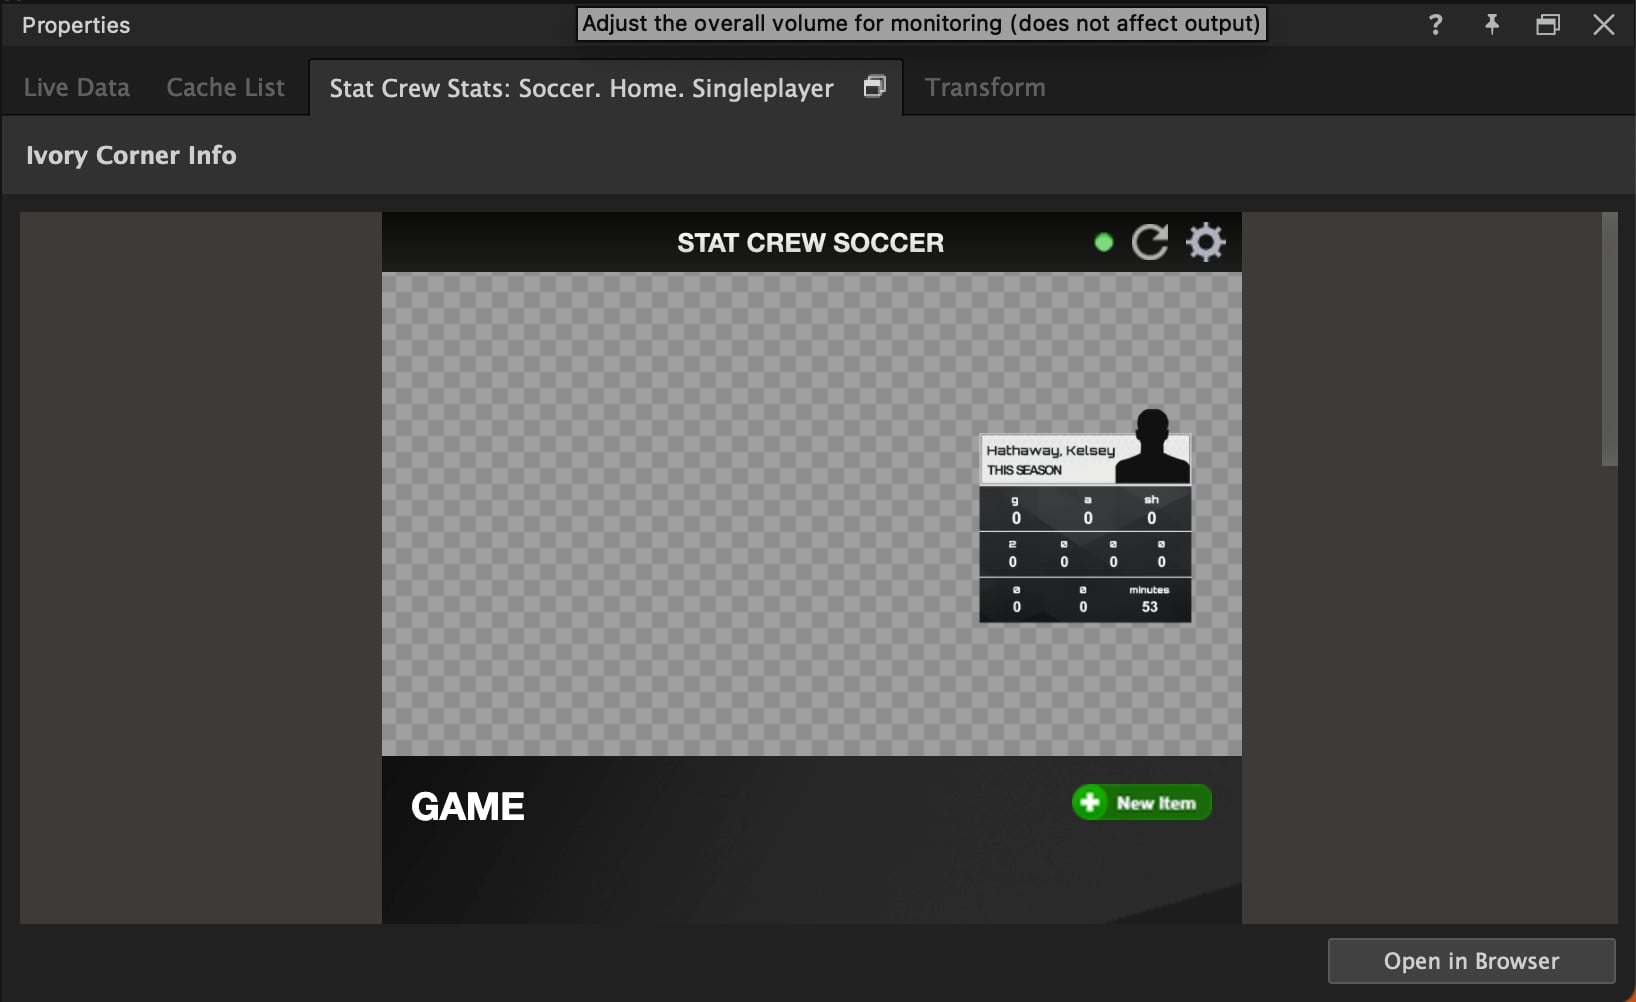
**❗ IMPORTANT**\
If the status light in the top-right corner is green, your XML is connected. If red:
* Your XML is not connected — reload or re-enter the path.
* Your XML is connected but isn’t returning the expected sport data — connect to a different XML file or input.
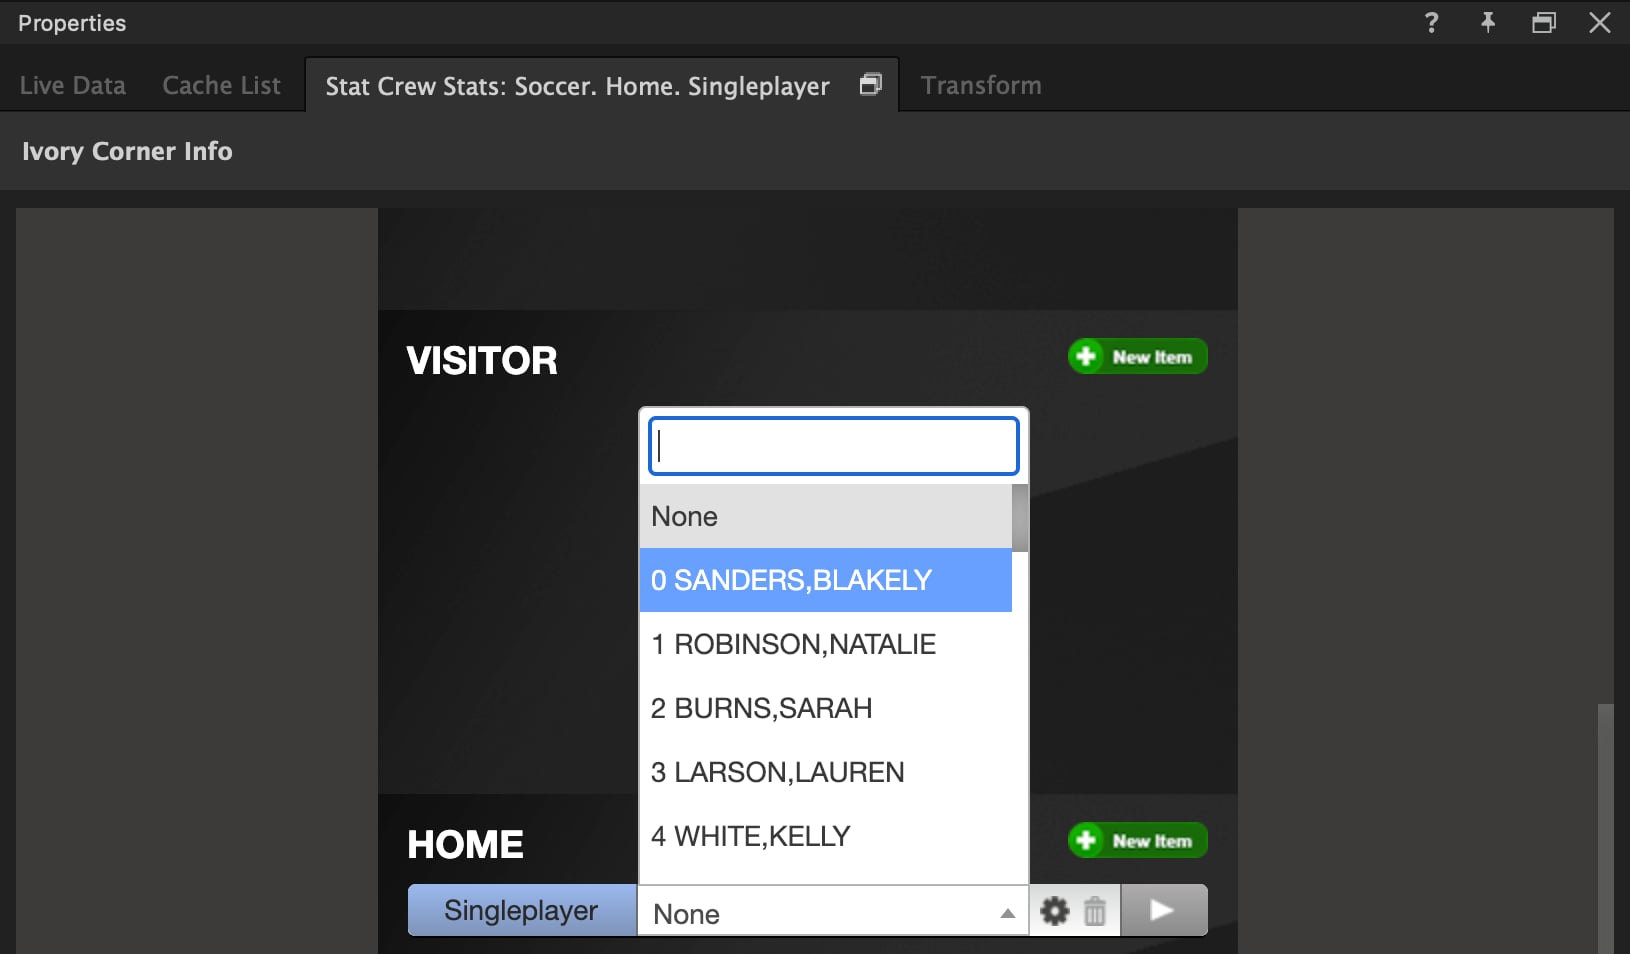
6. The selected data item populates under the chosen team. Select the player to highlight in the **Player** dropdown.
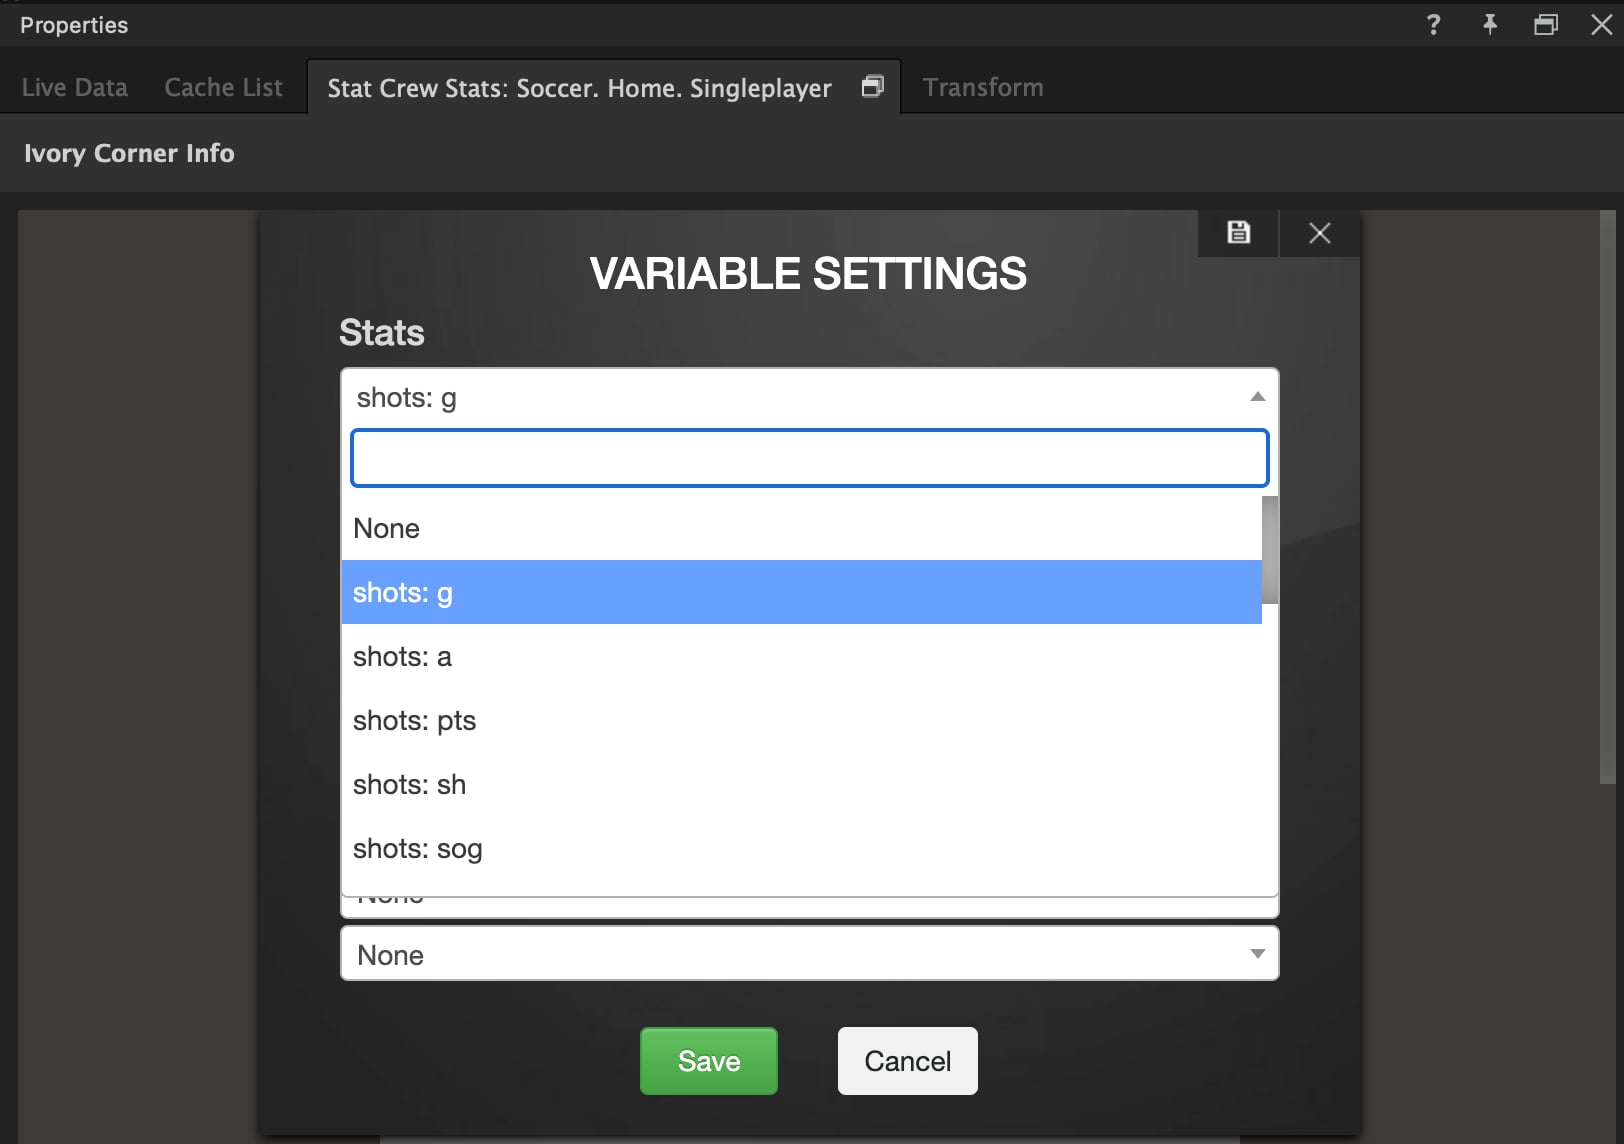
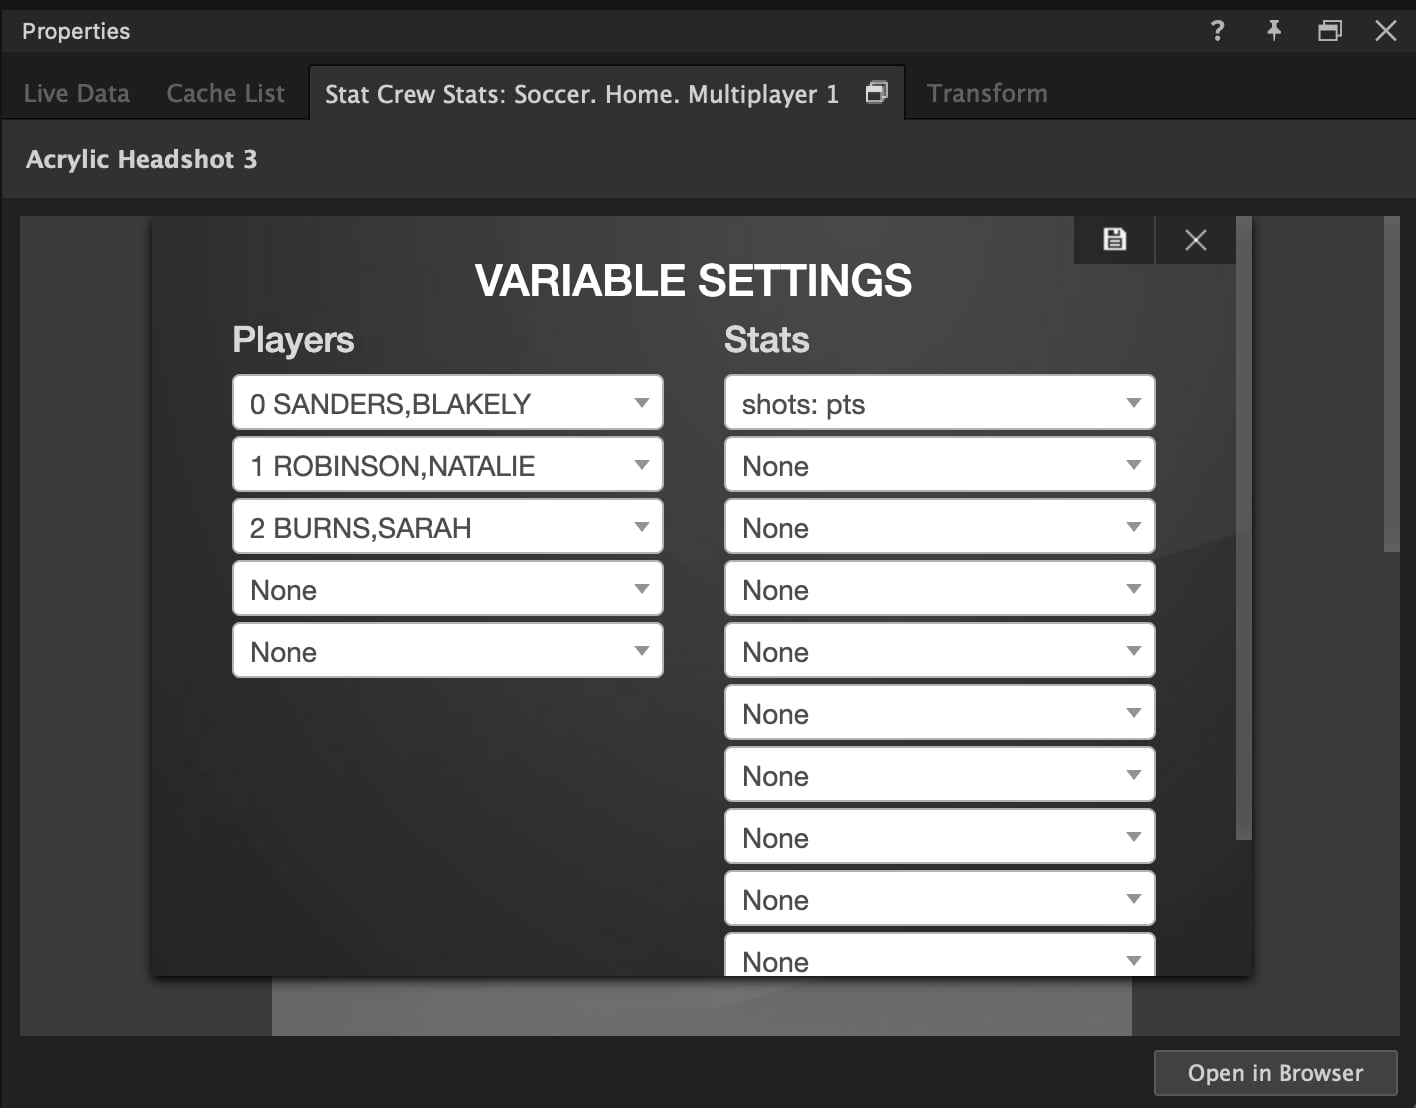
7. Use the gear icon to open **Variable Settings** and select the stats to represent in your graphic.
**💡 TIP**\
**Troubleshooting:** The dropdown tends to populate at the top of the controller. Scroll up if you don’t see it.
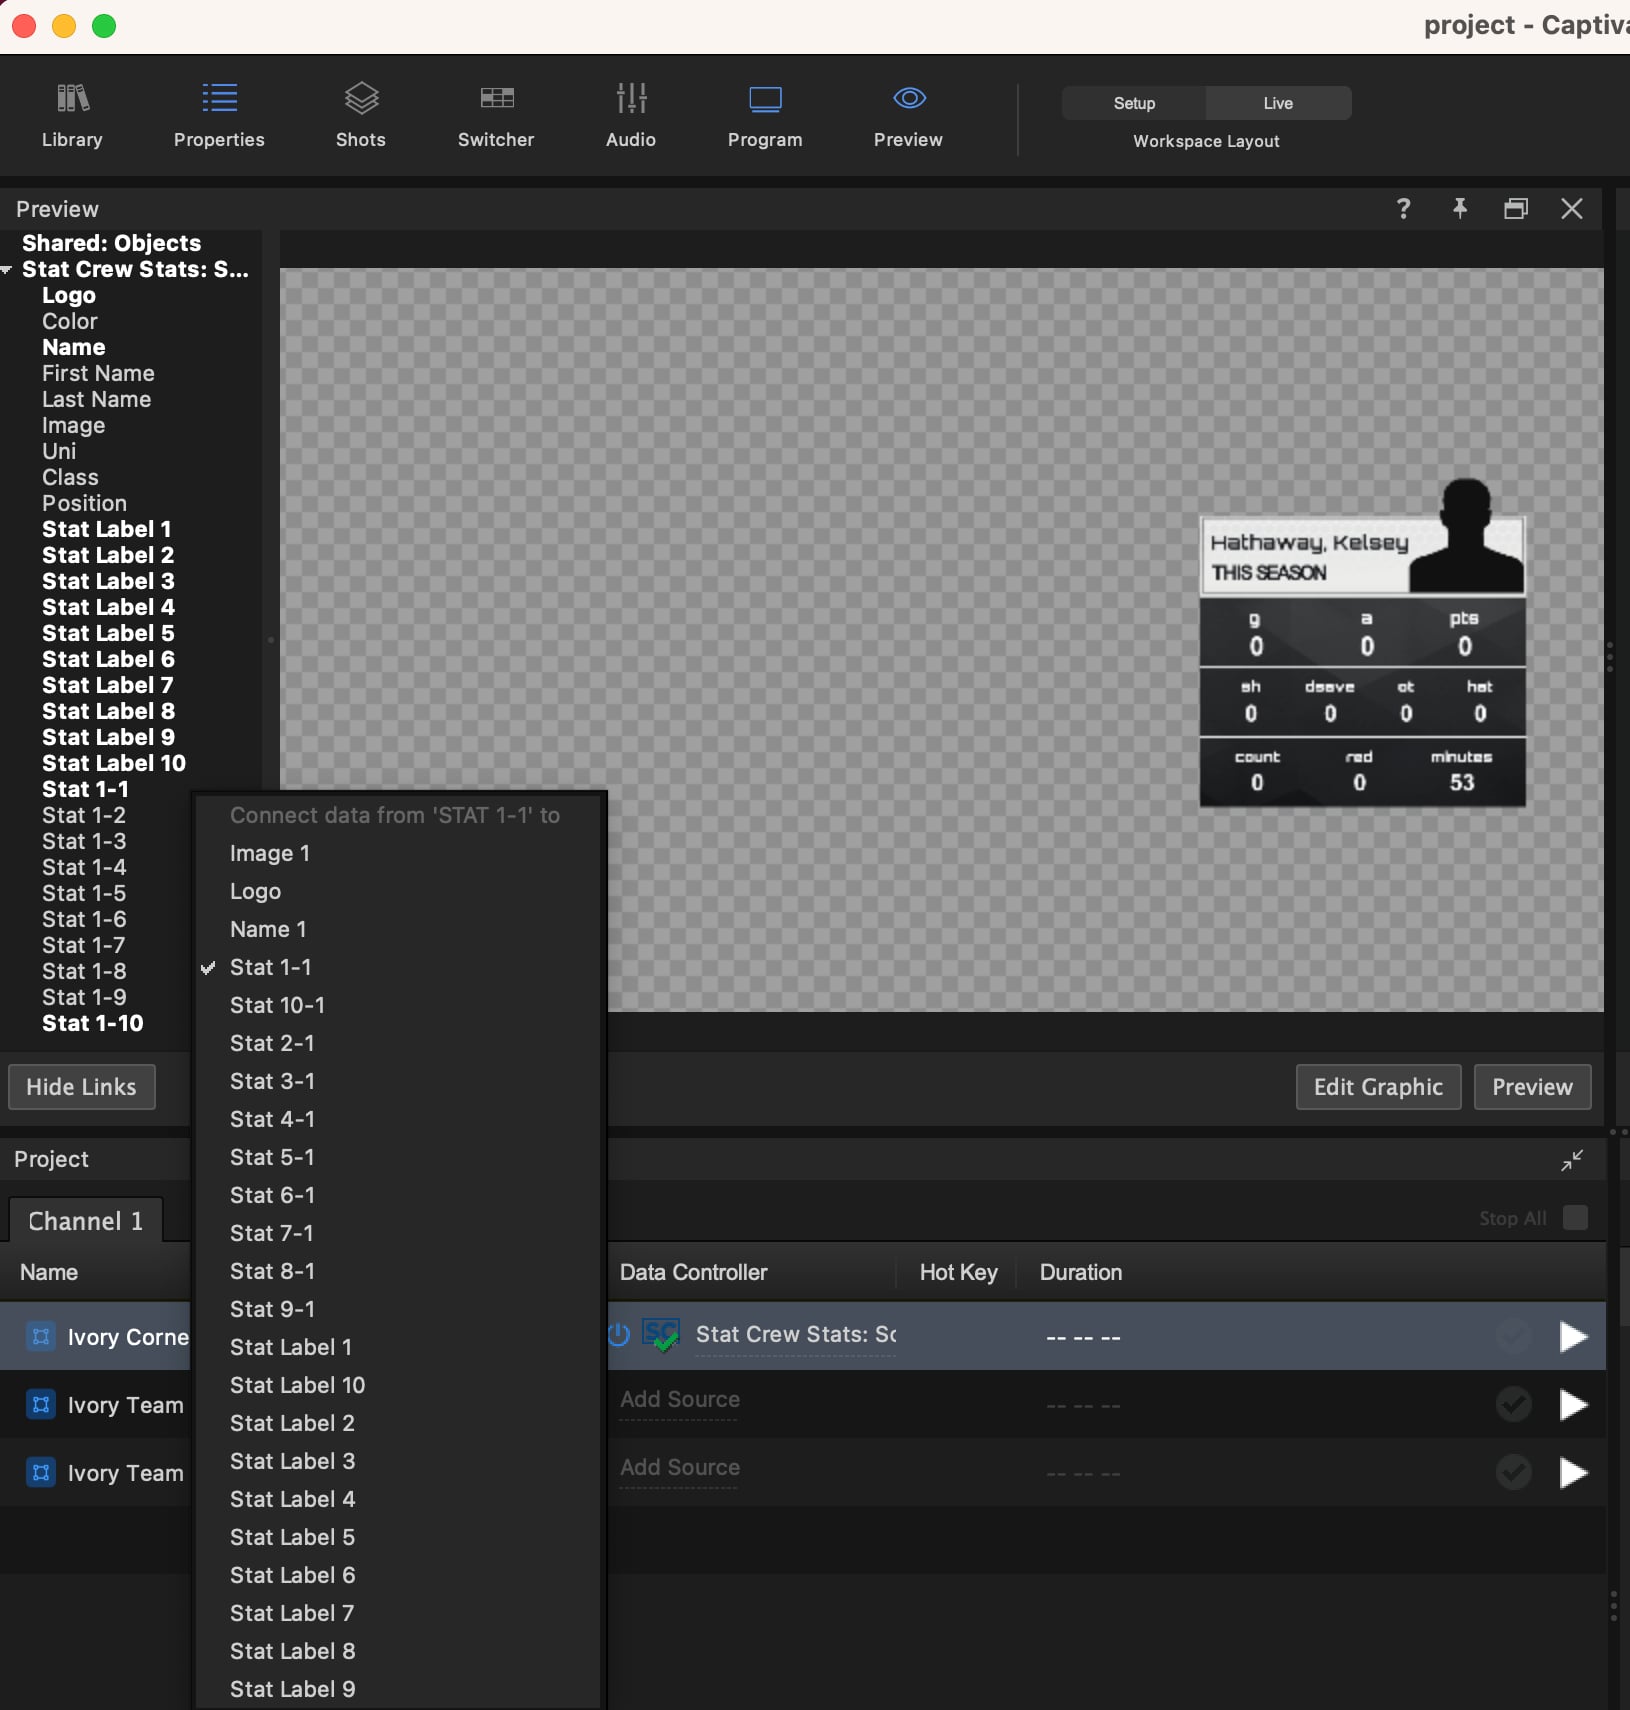
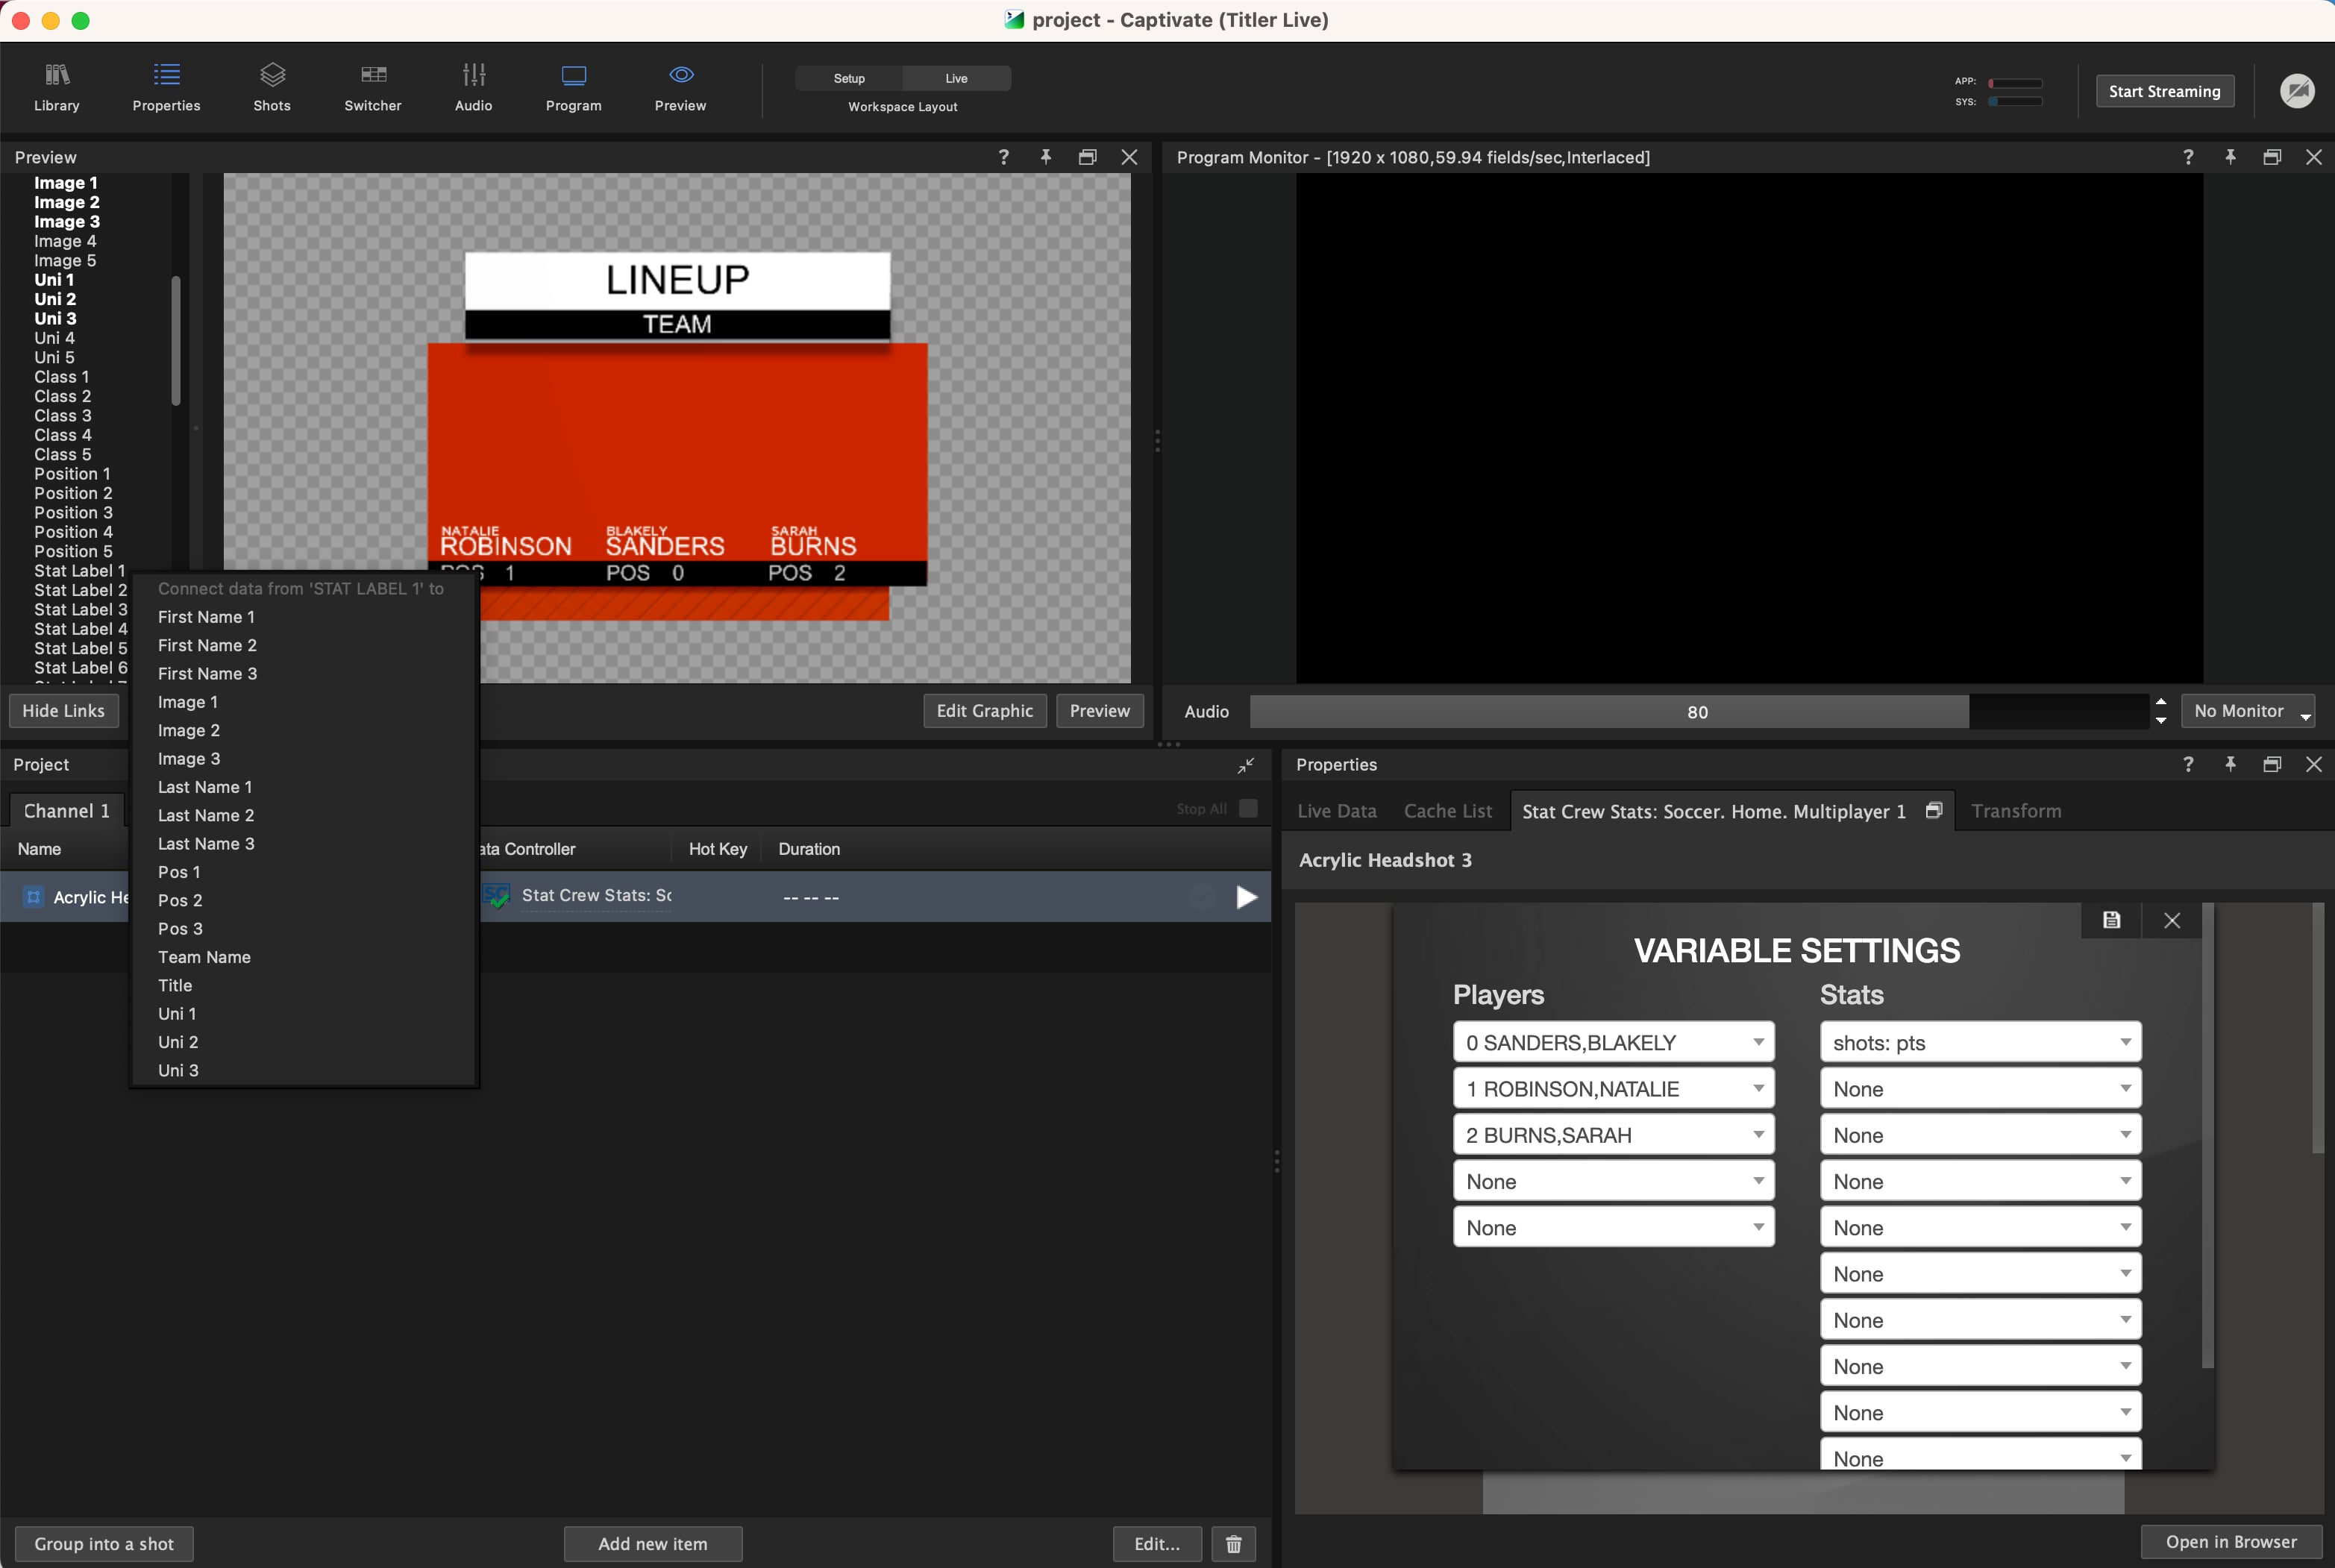
8. If there are missing data links, click **Link Data** in the **Preview** panel to view the input variables.
9. Click and drag a Stat Crew Stats variable onto an object in your graphic, or right-click to select the design object.
**📌 NOTE**\
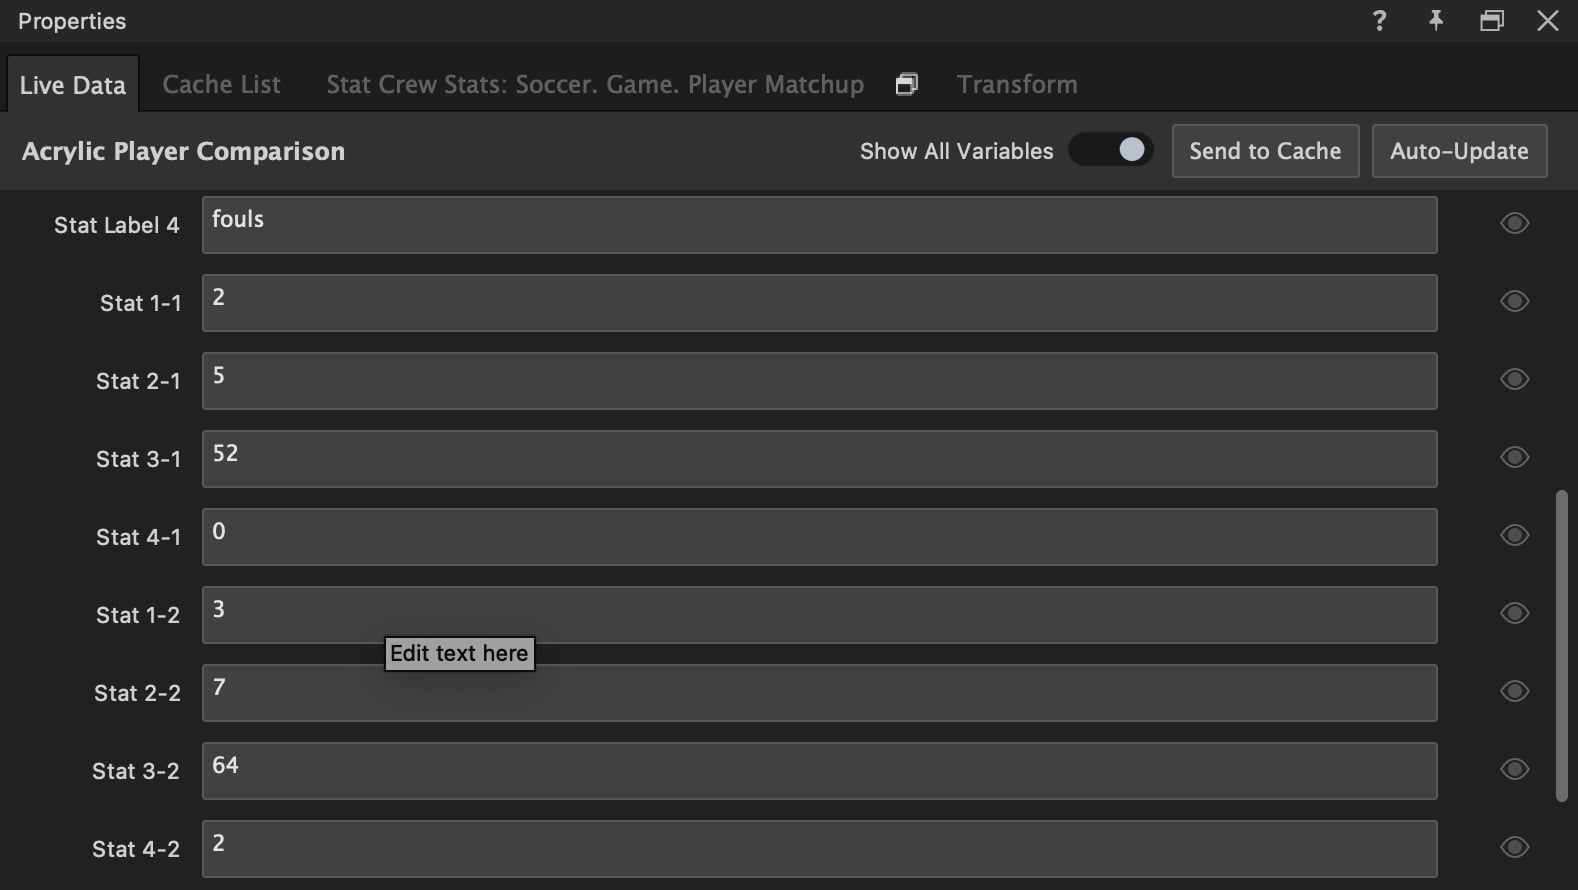
To verify which variable label maps to which team or player, reference the Live Values tab. Test by manually adjusting the data in the input box.
10. Repeat for each variable you want.
**📌 NOTE**\
To make manual changes live to your XML, save the XML so the changes are reflected in Captivate. See [Legacy XML controller](/play-and-update-graphics/chapter-index-2/legacy-xml-controller.md) for the older **General > XML** / **Sports > XML** menu flow, or [Tables](/play-and-update-graphics/chapter-index-1/tables-overview.md) to switch a project to the new Tables controller.
## Multiplayer Stats on the Same Team
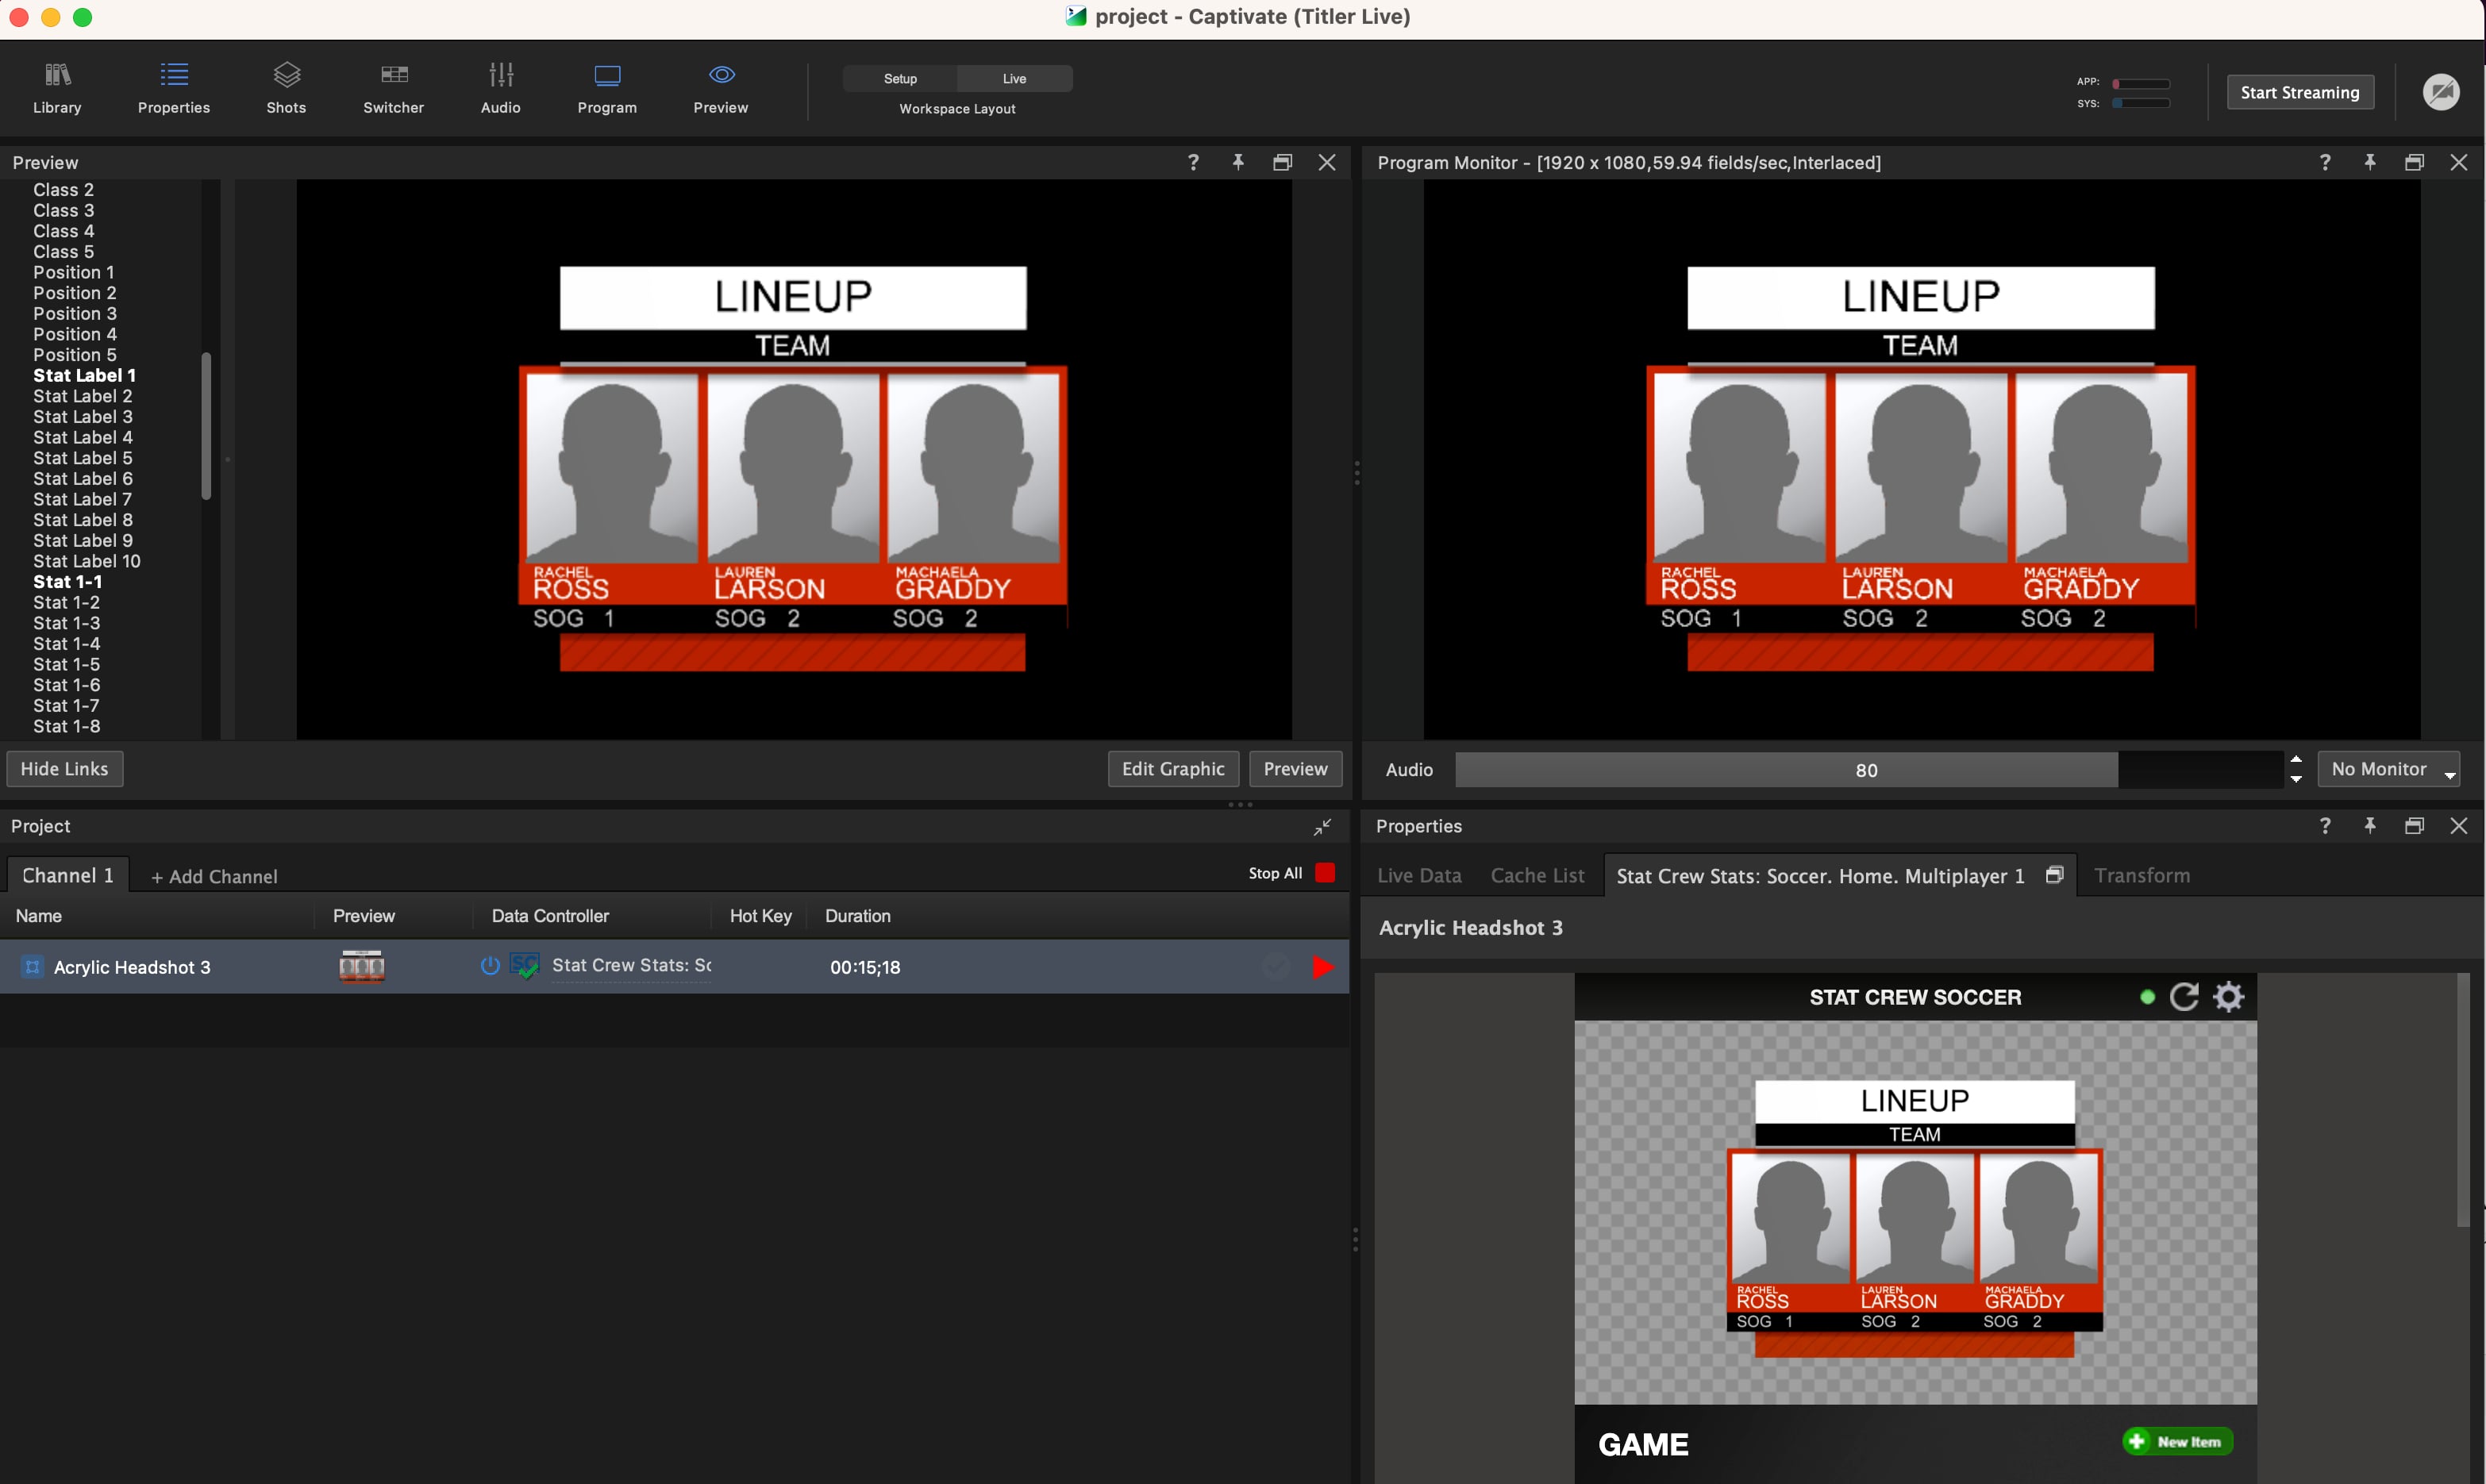
This workflow connects Stat Crew data from a single team for multi-player comparisons or single-team showcases.
1. Ensure your textures folder is set up as described in the Single Player Stats section above.
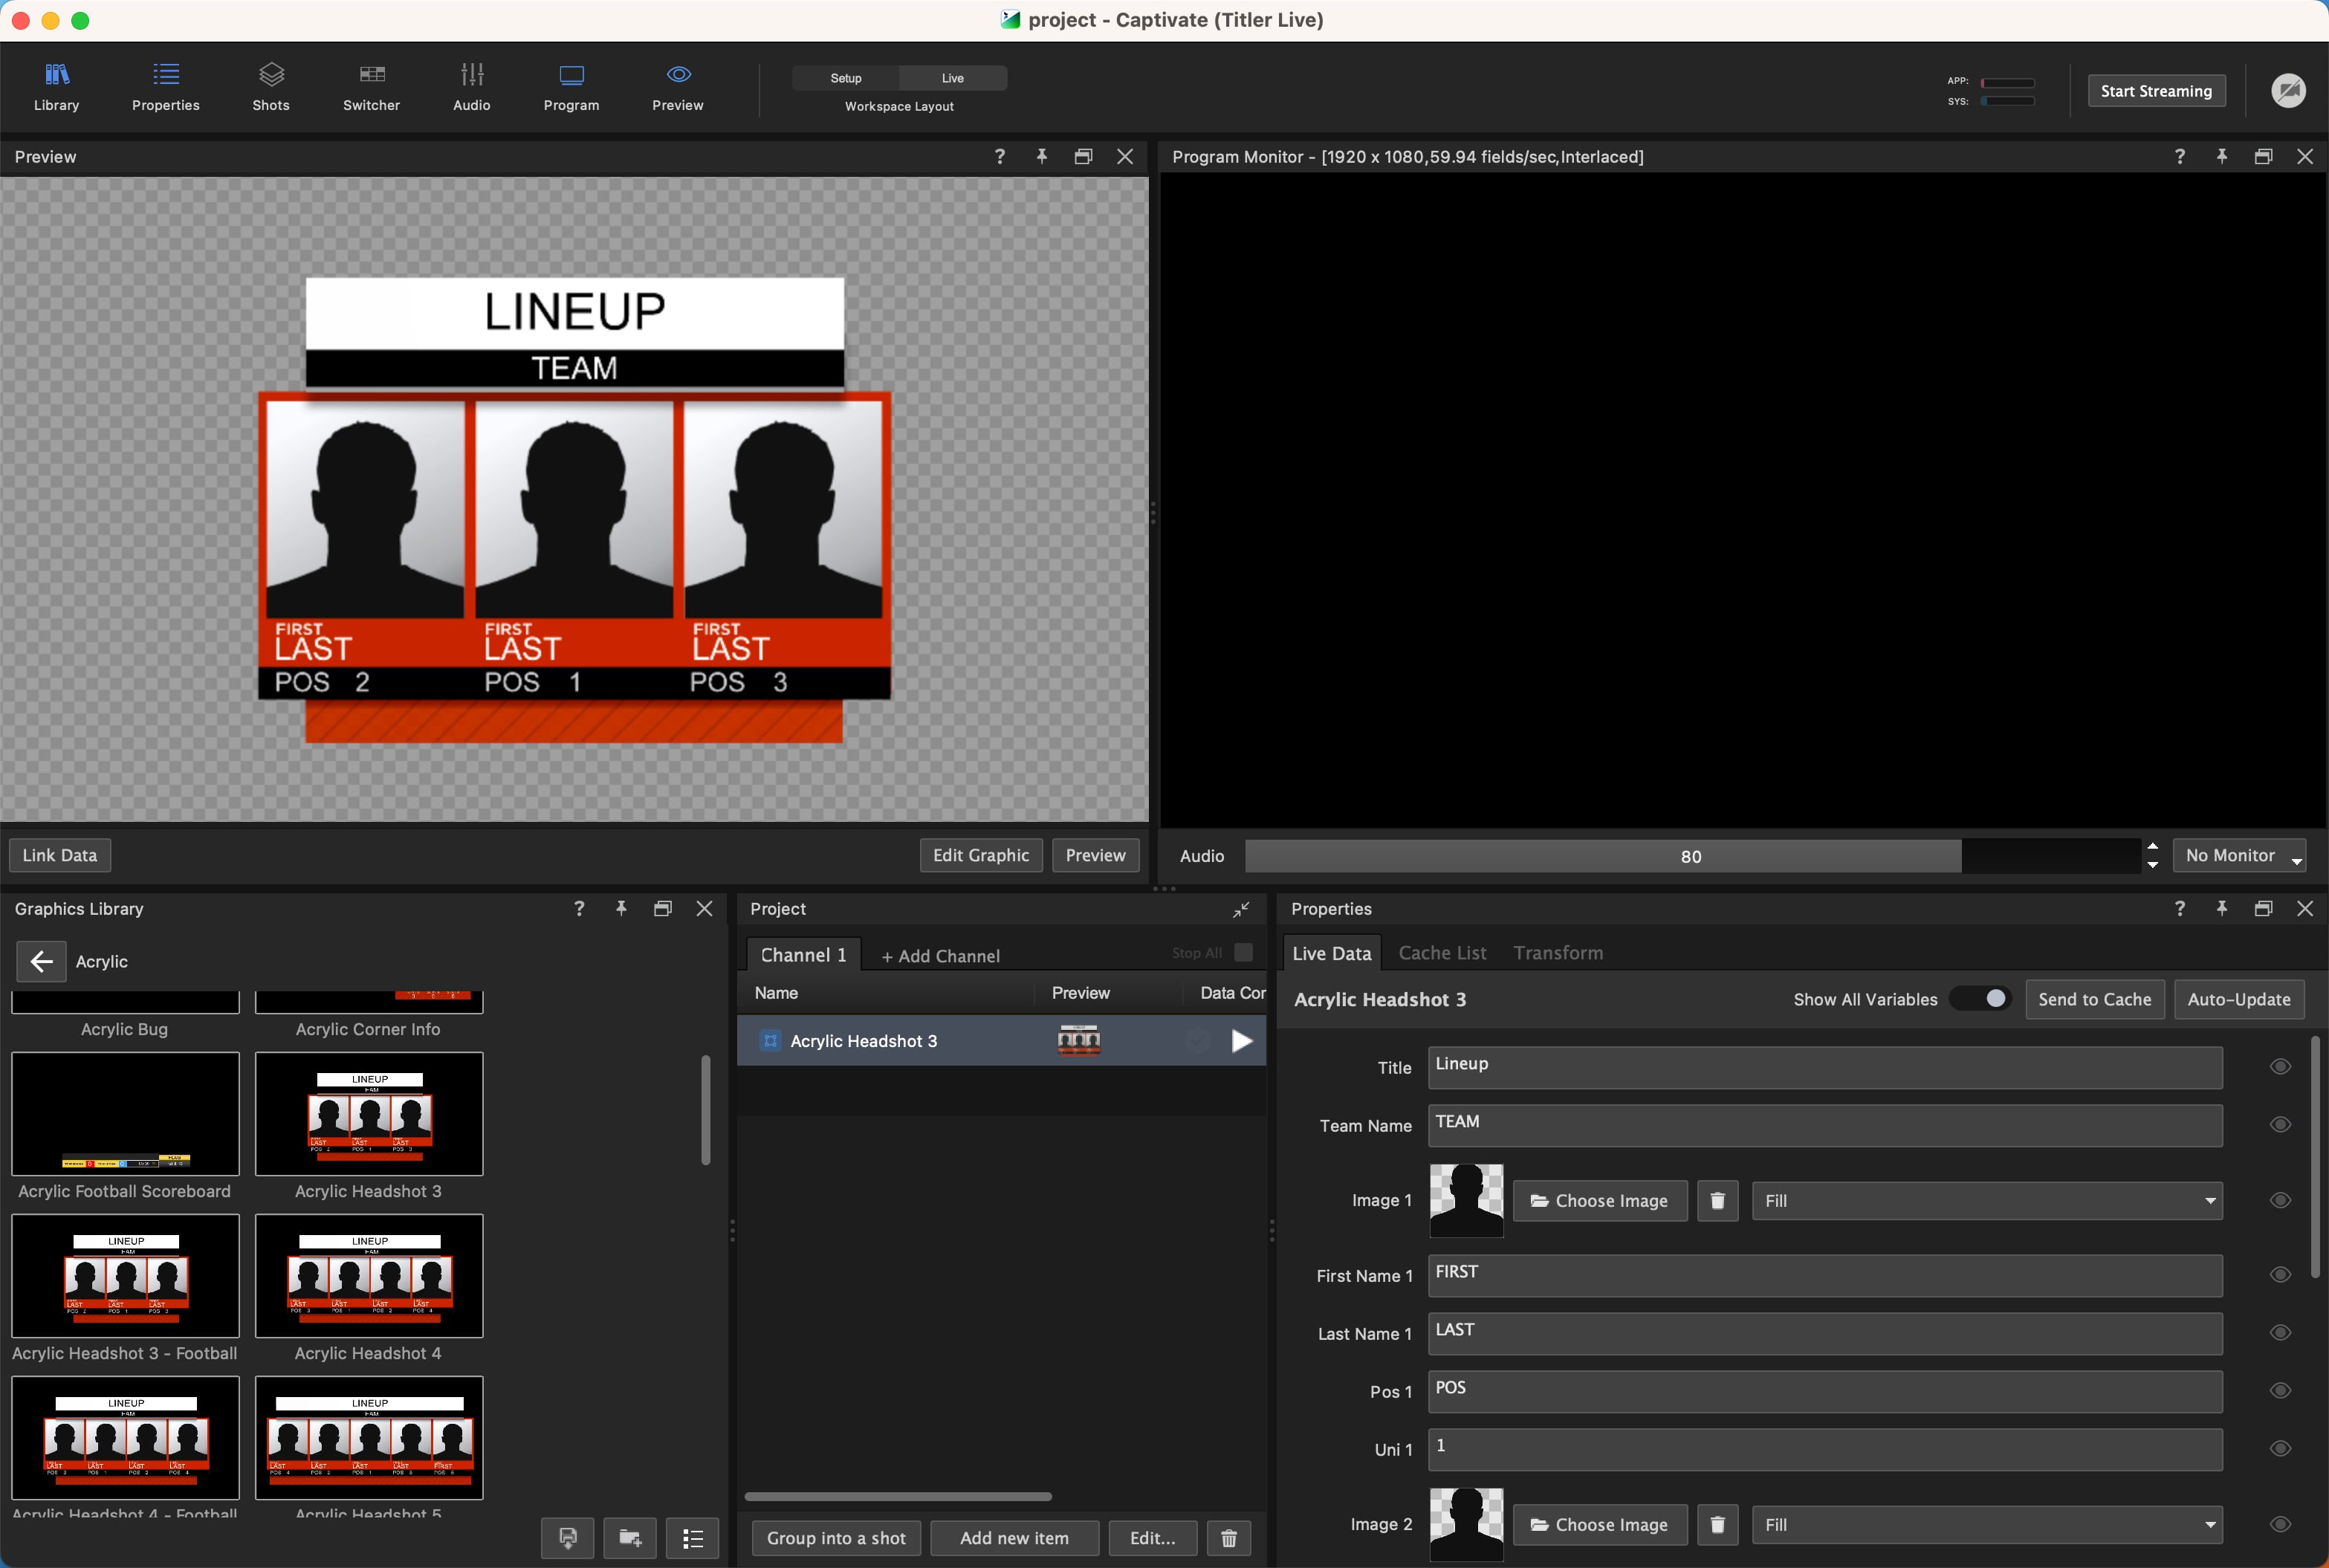
2. Open a project and select a graphic in the Project List.
**💡 TIP**\
For best results, use a matching graphic template (e.g., Acrylic Headshot 3).
3. Under Data Controller, select **Add source** > **Sports** > **Stat Crew Stats** > **Sport** > **Team** > **Multiplayer 1**.
4. Navigate to the Stat Crew Stats controller tab and select your XML file.
**❗ IMPORTANT**\
Verify the status light is green.
5. Select the gear icon next to the team to configure data assignments.
6. Use the **Players** dropdown to select the players to highlight.
7. Use the **Stats** dropdown to select the stats.
8. Click **Link Data** in the **Preview** panel to connect any missing links.
9. Drag-and-drop or right-click to link each variable.
**💡 TIP**\
**Troubleshooting:** If the graphic goes white after connecting or re-assigning variables, click **Edit Graphic** in the Designer, highlight the affected layers, navigate to **Properties > Style**, and ensure variable is unchecked under Color Style. Save and return.
10. To link images, click on the image design element in the Preview panel and assign the file location.
## Comparing Stats from both Teams
This workflow compares Stat Crew data across both teams in the game for matchup graphics.
1. Set up your textures folder as described above.
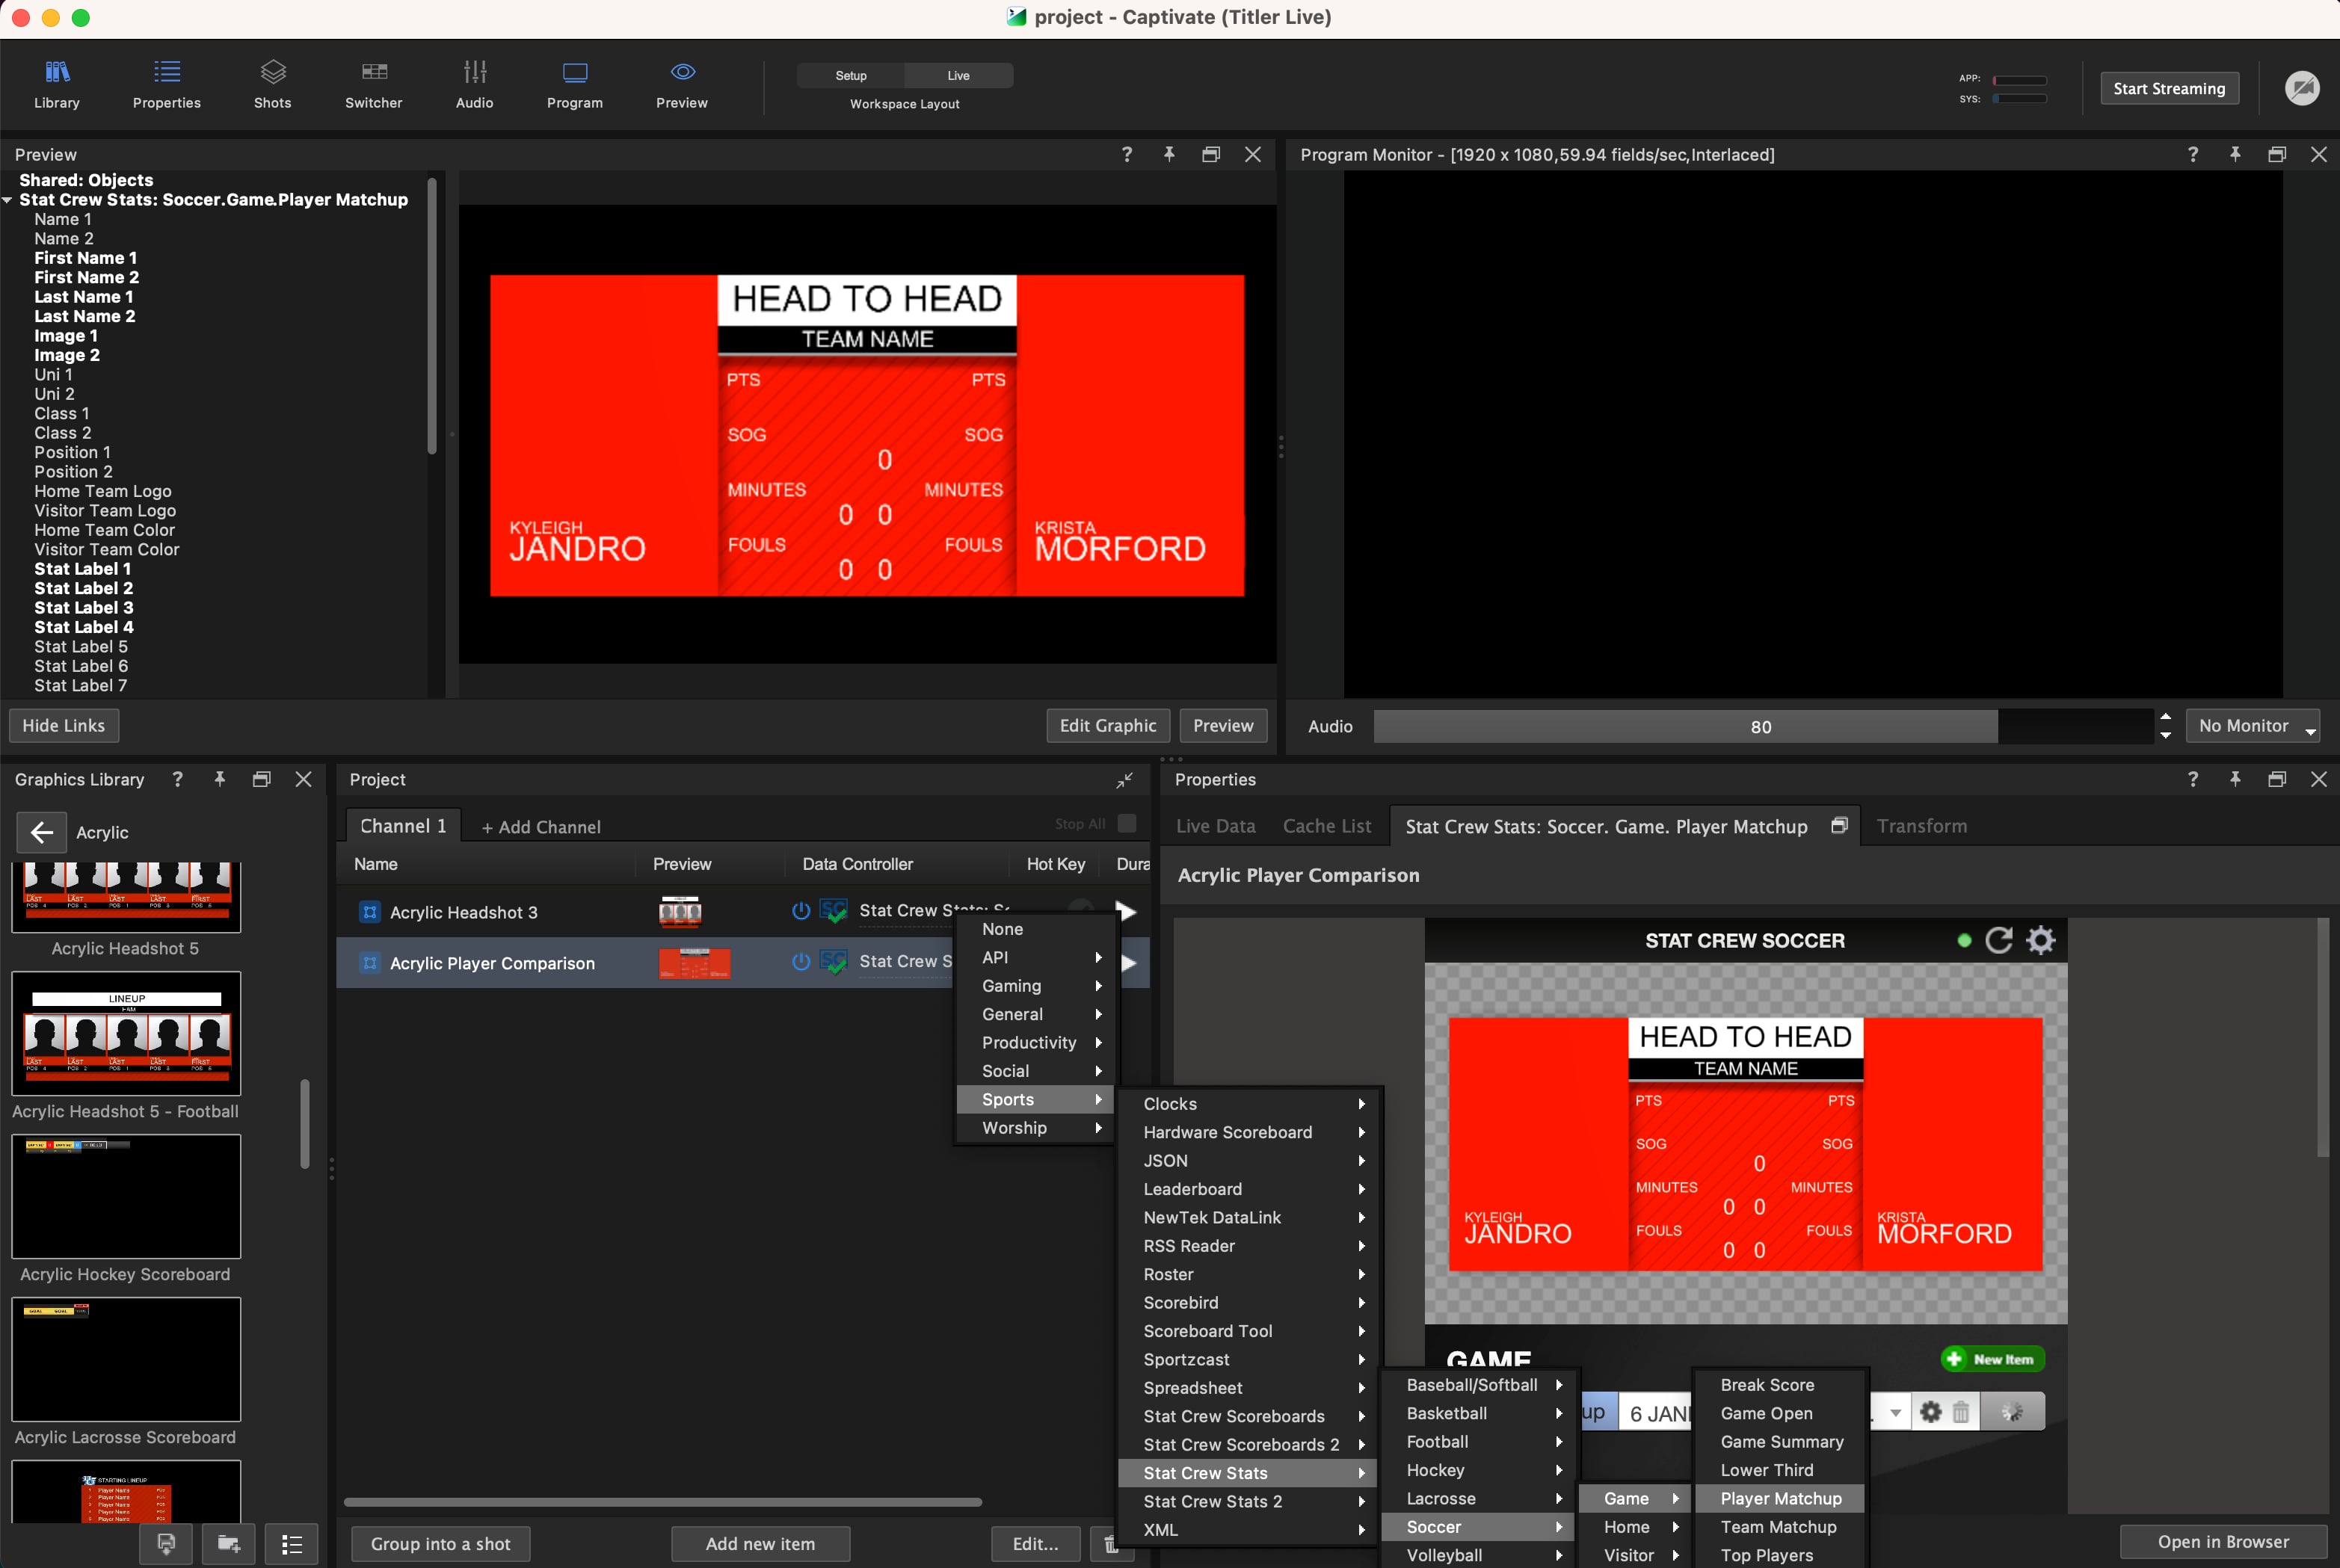
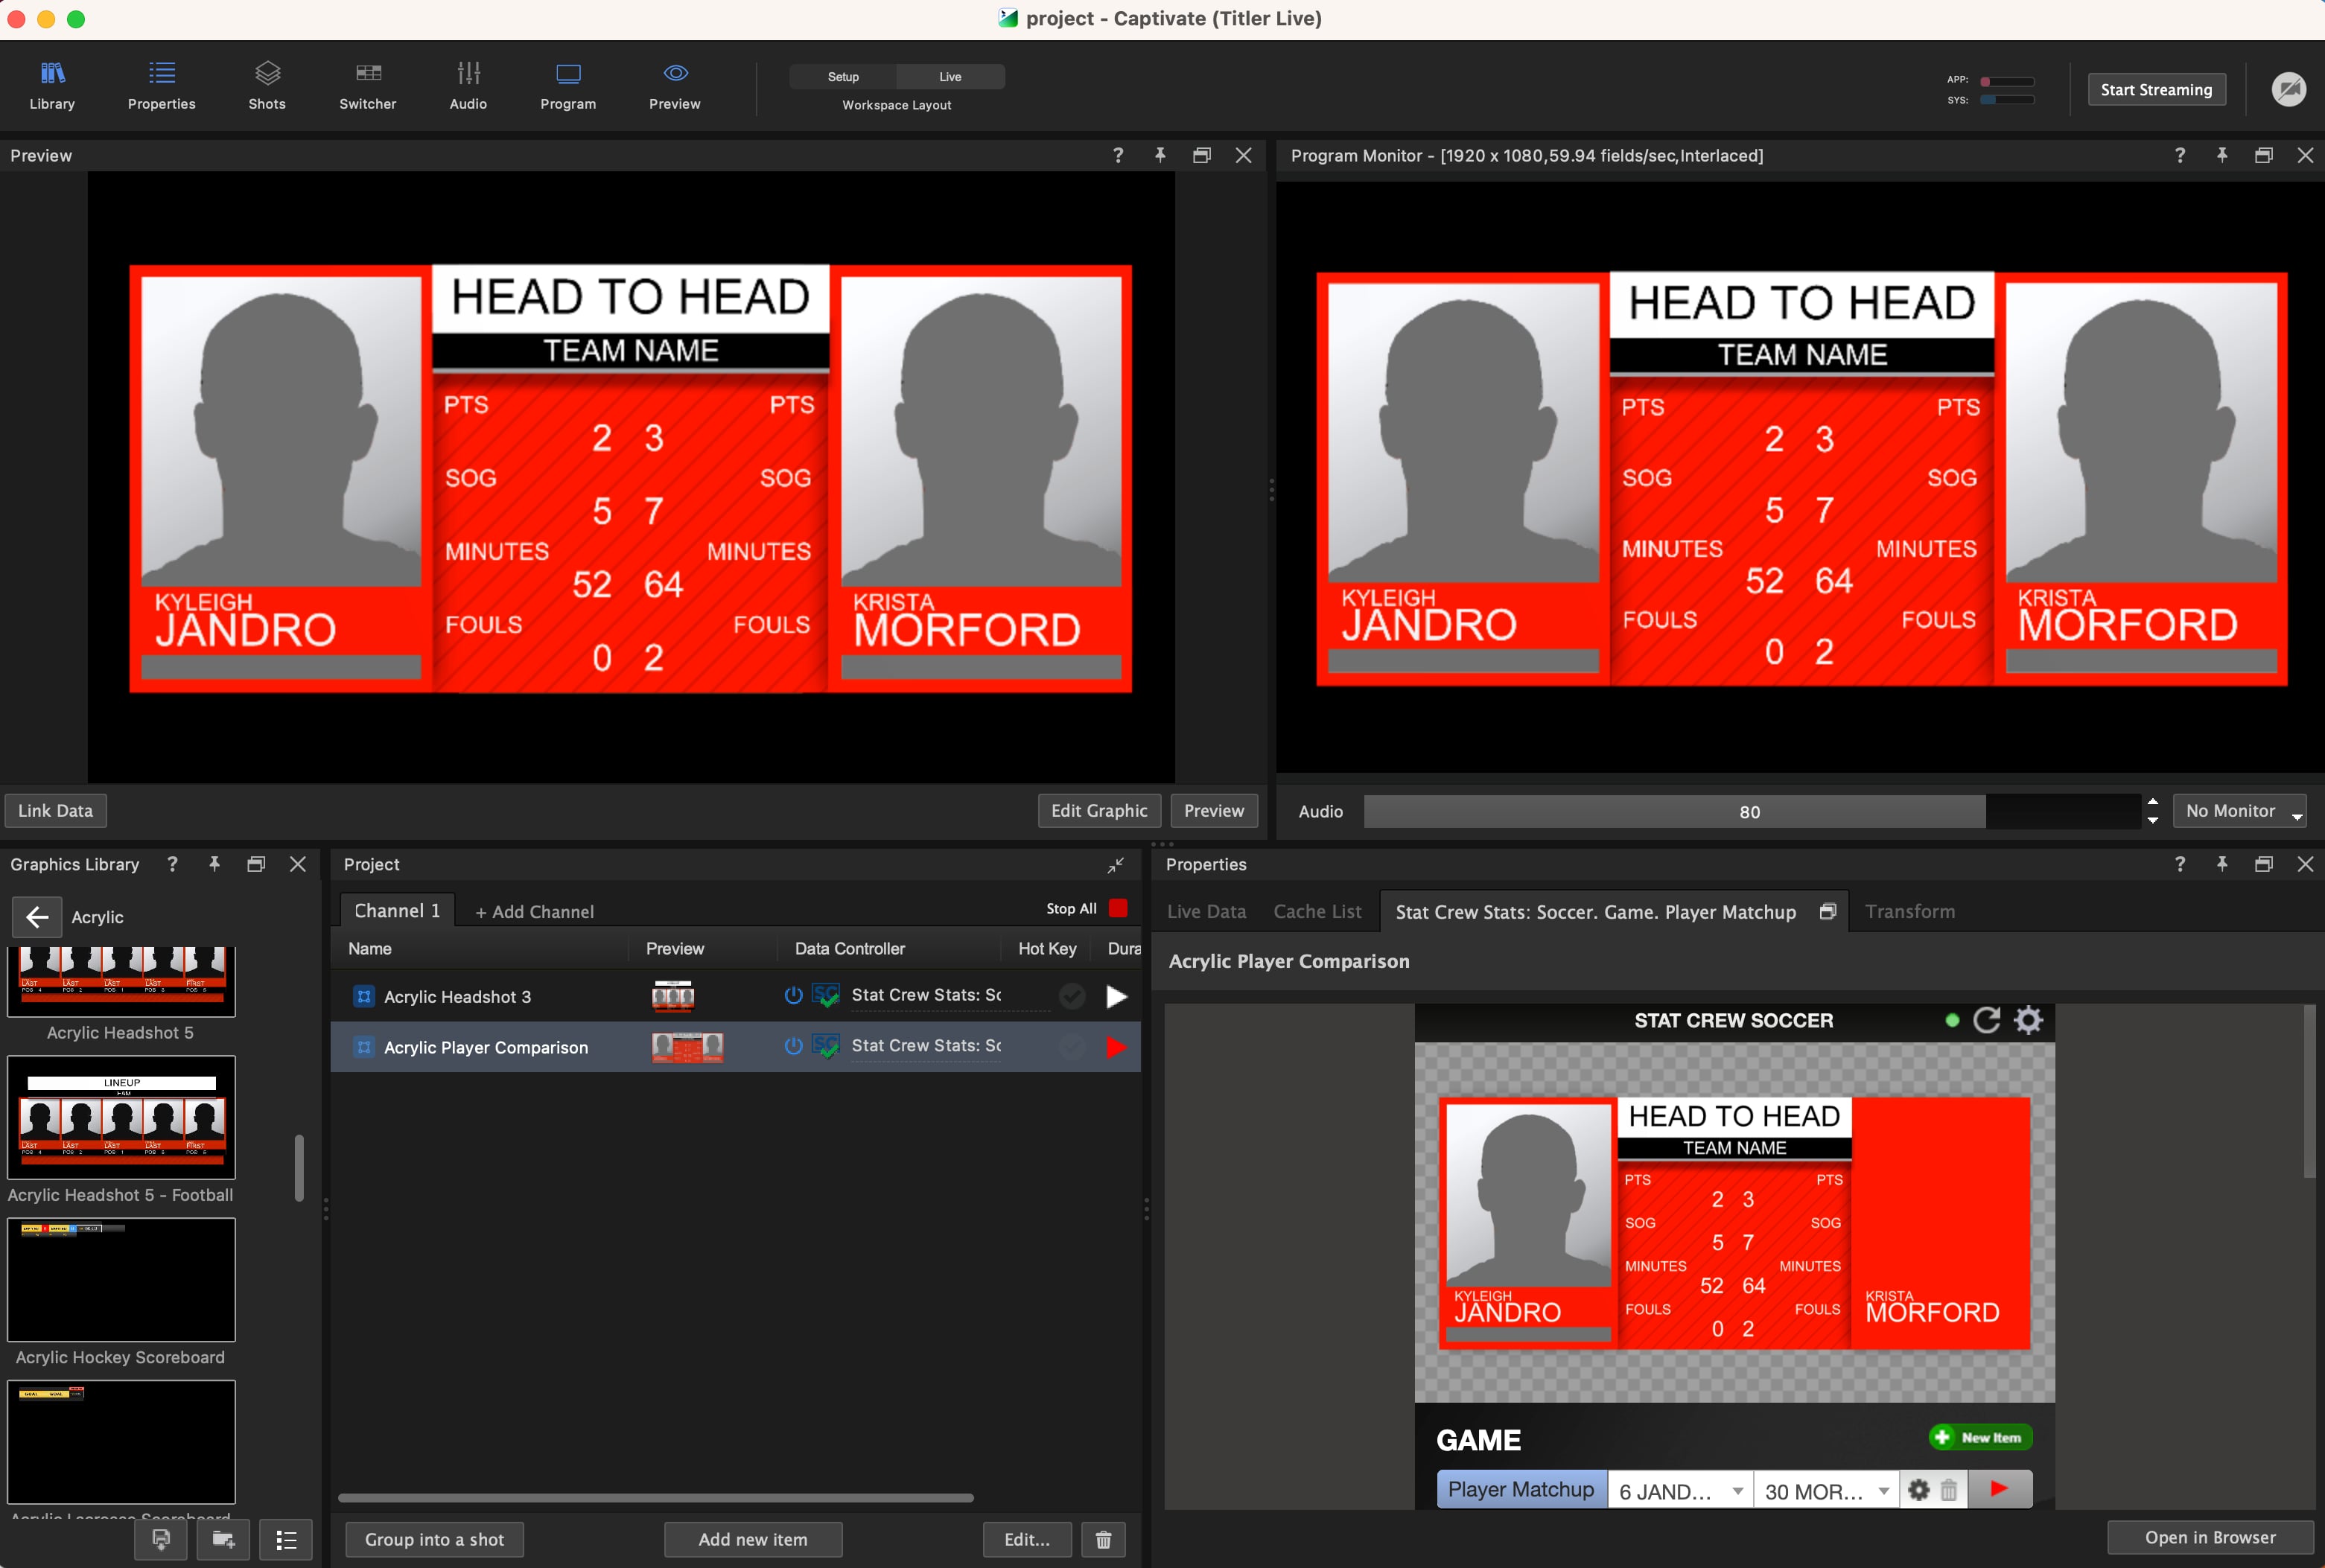
2. Open a project and select a graphic in the Project List.
**💡 TIP**\
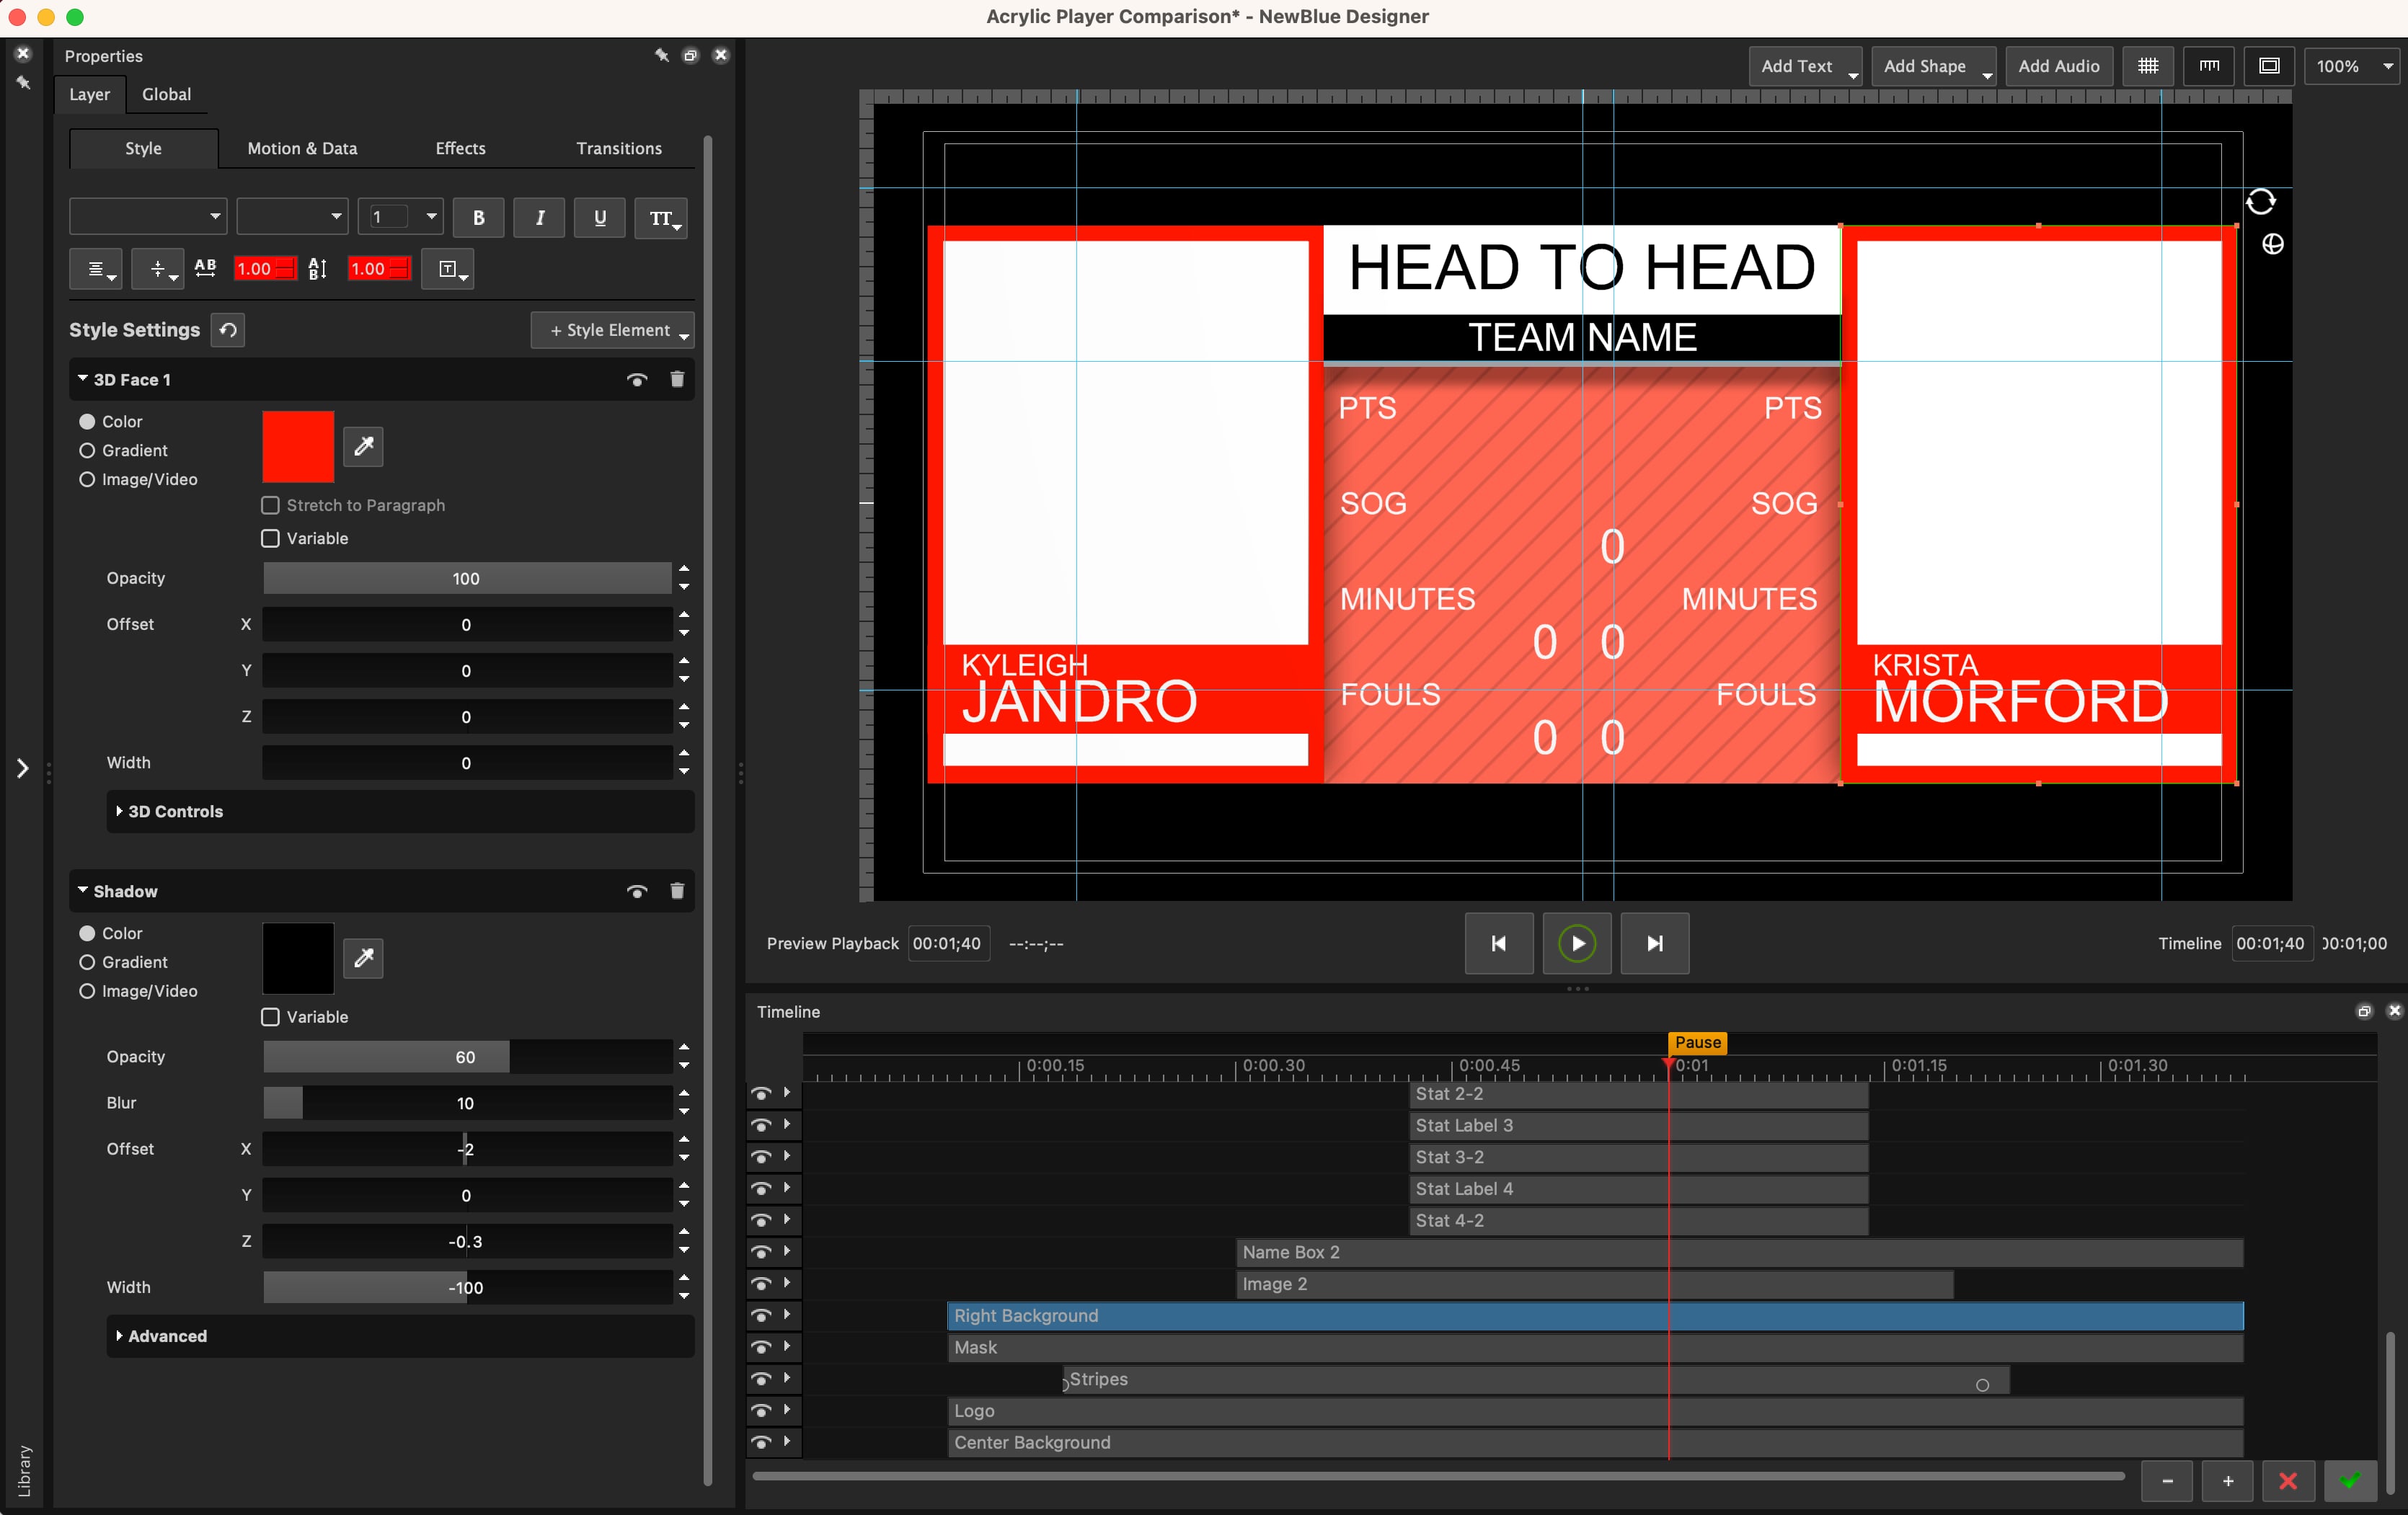
For best results, use a matching graphic template (e.g., Acrylic Player Comparison).
3. Under Data Controller, select **Sports** > **Stat Crew Stats** > **Sport** > **Game** > **Player Matchup** (or matching data type).
4. Navigate to the Stat Crew Stats controller tab and select your XML file.
**❗ IMPORTANT**\
Verify the status light is green.
5. Navigate to **Game > Player Matchup** to select the players from each team’s dropdown.
6. Select the gear icon next to **Player Matchup** to configure stats.
7. Use the **Stats** dropdown to select the stats.
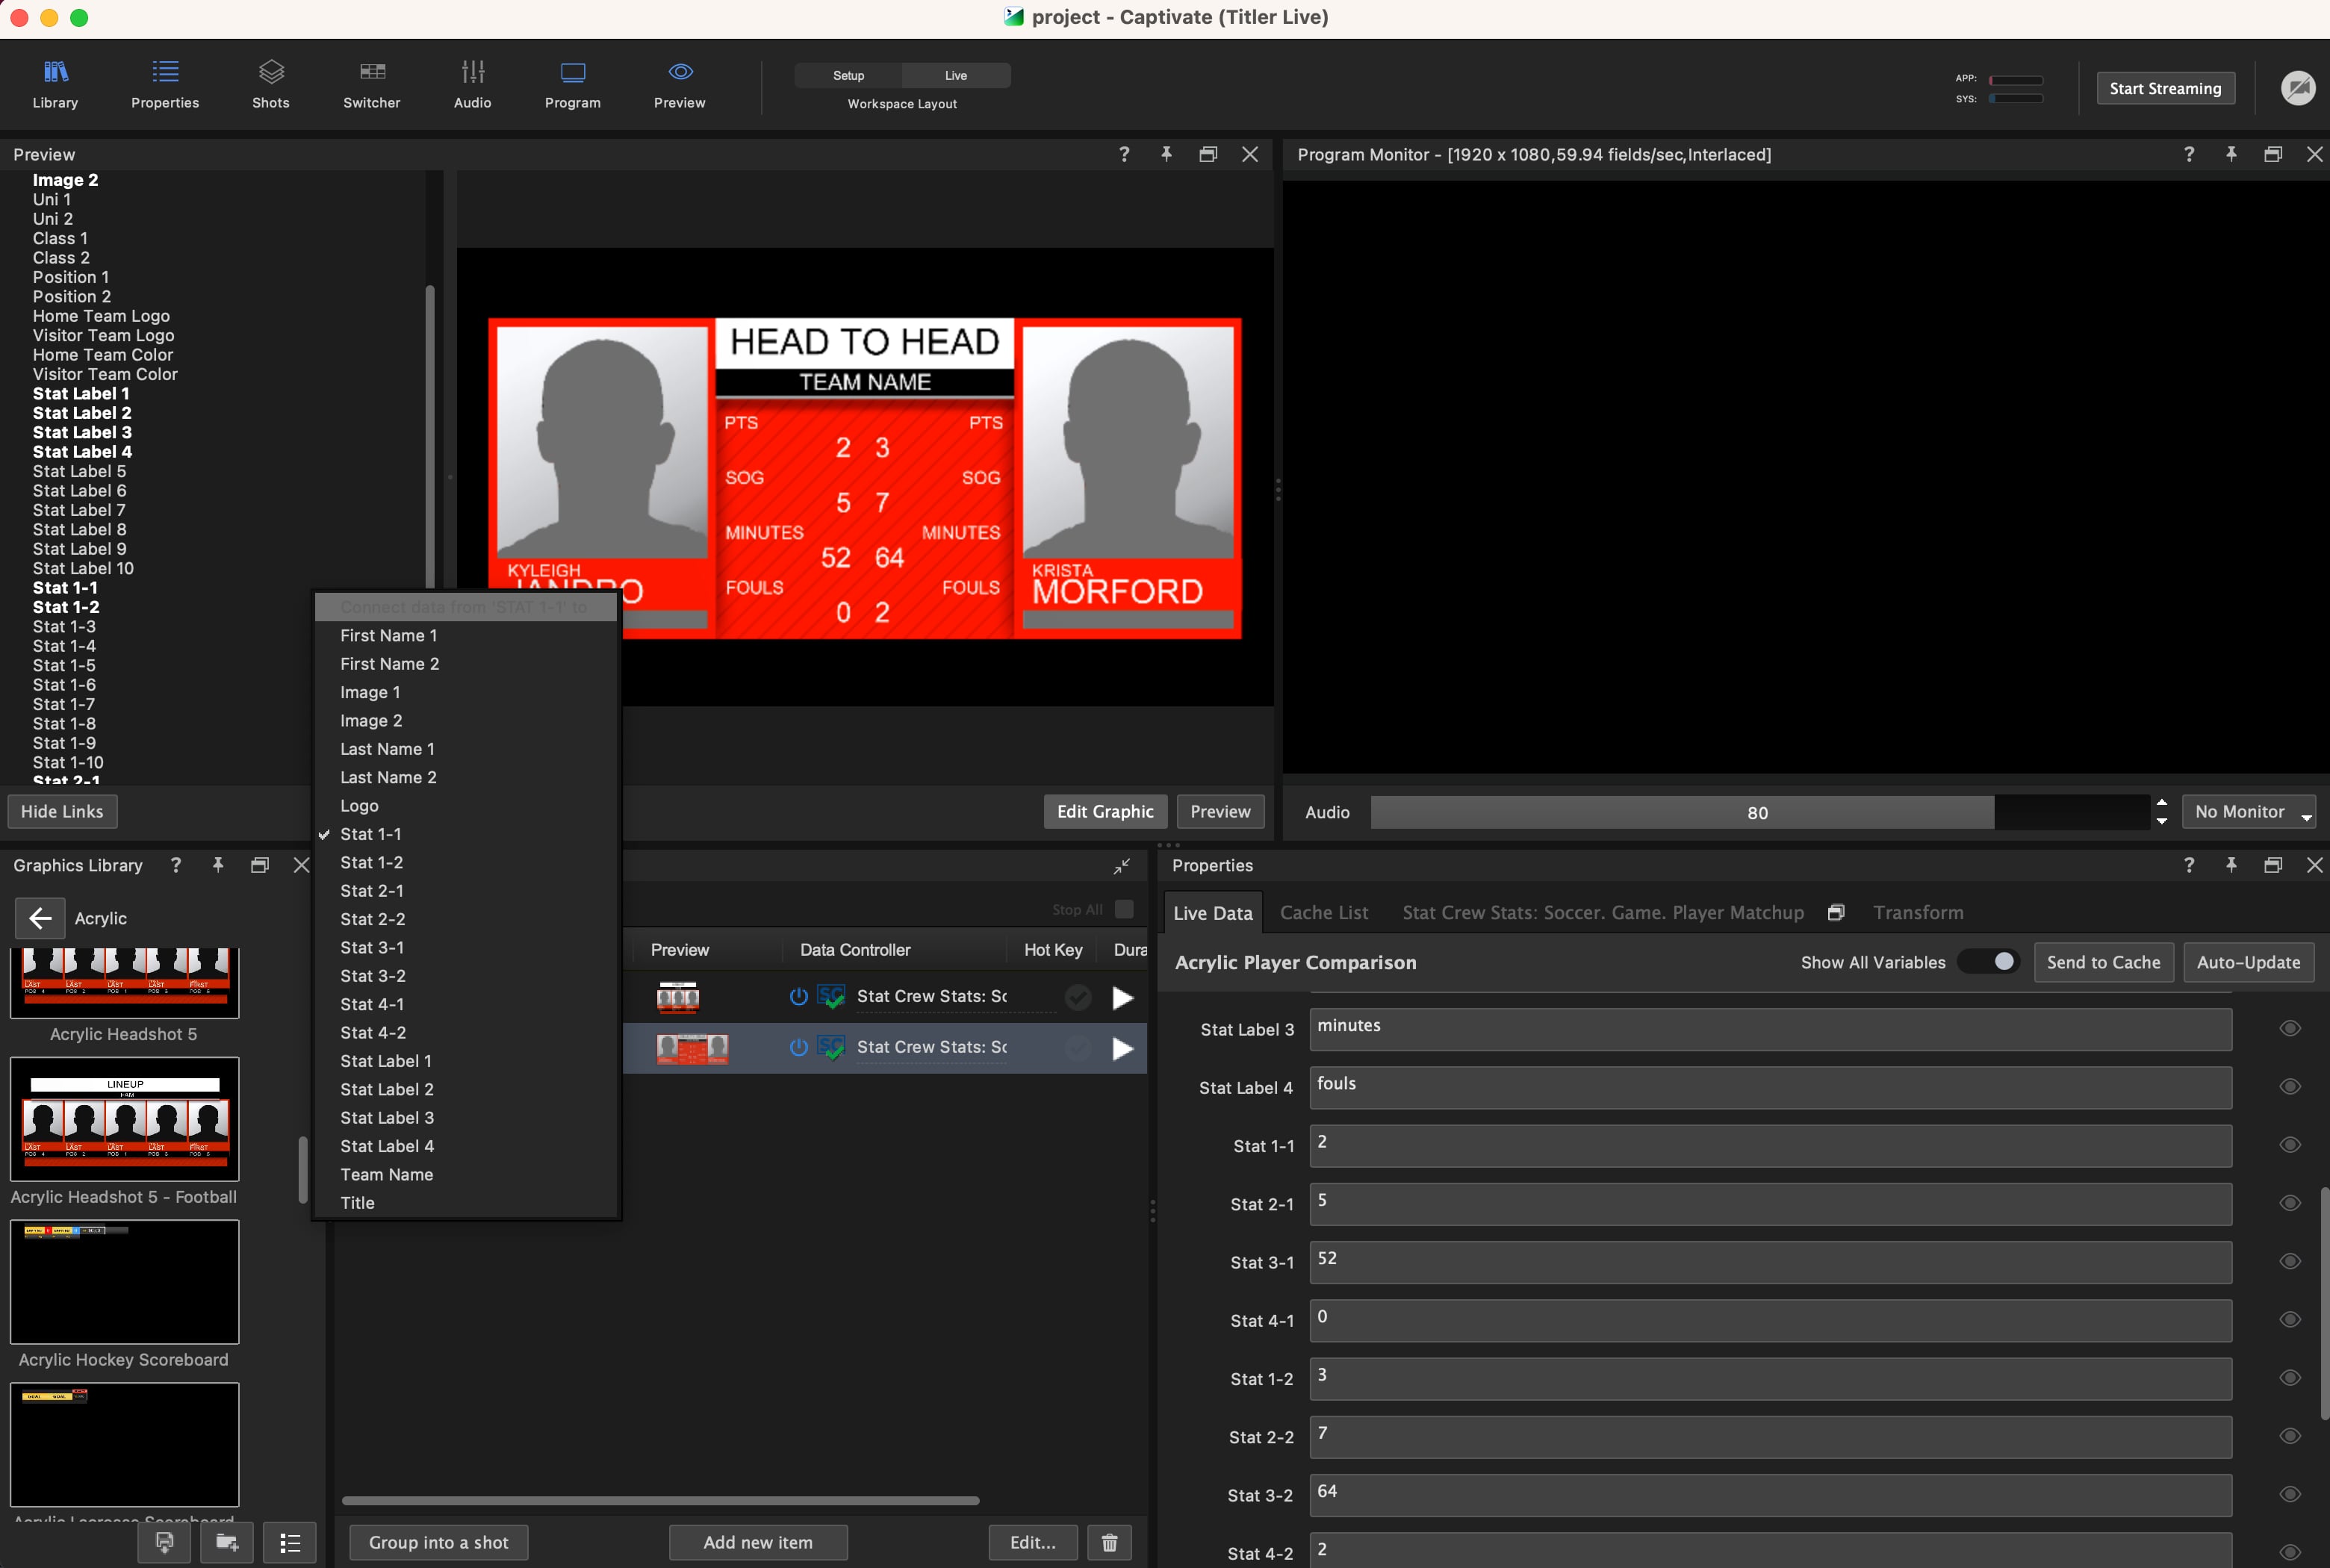
8. Click **Link Data** in the **Preview** panel and connect any missing variables.
9. Drag-and-drop or right-click to link each variable.
10. Repeat for each variable.
**📌 NOTE**\
To make manual changes live to your XML, save the XML.
## Stat Crew Scoreboards
Stat Crew offers two different controllers, and which one you want depends on what you are putting on air.
* **Stat Crew Statistics** — the one this article covers above. Player and team statistics: leaders, comparisons, box-score figures.
* **Stat Crew Scoreboards** — the live score state instead. Teams, score, period, possession, fouls and timeouts, as the game runs.
Connect a scoreboard the same way: choose **Select a Datasource**, find **Stat Crew Scoreboards**, and pick your sport. The controller appears as a tab in the **Layer Properties** panel, and you link its variables to your design exactly as you would for statistics.
The variables a scoreboard offers are the ones a scoreboard needs, and they vary by sport. Basketball, for example, provides:
| Variable | Holds |
| ---------------------------------------- | ------------------------------------------- |
| `Home Team` / `Visitor Team` | Full team names |
| `Home Team Short` / `Visitor Team Short` | Abbreviated names, for narrow lower thirds |
| `Home Score` / `Visitor Score` | The score |
| `Period` | The current period |
| `Home Poss.` / `Visitor Poss.` | Which team has possession |
| `Home Fouls` / `Visitor Fouls` | Team fouls |
| `Home Timeouts` / `Visitor Timeouts` | Timeouts remaining |
| `Message` | A free-text line you can put on the graphic |
Other sports carry the fields that sport needs — the tab lists everything available once you have selected one, so connect from what you see there rather than assuming the set above.
**💡 TIP**\
You can run both controllers at once. A common arrangement is a persistent scoreboard driven by **Stat Crew Scoreboards** and a lower third driven by **Stat Crew Statistics**, each on its own graphic.
---
# Agent Instructions
This documentation is published with GitBook. GitBook is the documentation platform designed so that both humans and AI agents can read, navigate, and reason over technical content effectively. Learn more at gitbook.com.
## Querying This Documentation
If you need additional information that is not directly available in this page, you can query the documentation dynamically by asking a question.
Perform an HTTP GET request on the current page URL with the `ask` query parameter, and the optional `goal` query parameter:
```
GET https://captivatehelp.newbluelive.com/play-and-update-graphics/chapter-index-3/connect-statcrew.md?ask=&goal=
```
`ask` is the immediate question: it should be specific, self-contained, and written in natural language.
`goal` is optional and describes the broader end goal you are ultimately trying to accomplish on behalf of the user. GitBook uses it to tailor the answer towards what is most useful for that goal.
The response will contain a direct answer to the question and relevant excerpts and sources from the documentation.
Use this mechanism when the answer is not explicitly present in the current page, you need clarification or additional context, or you want to retrieve related documentation sections.