> For the complete documentation index, see [llms.txt](https://captivatehelp.newbluelive.com/llms.txt). Markdown versions of documentation pages are available by appending `.md` to page URLs; this page is available as [Markdown](https://captivatehelp.newbluelive.com/play-and-update-graphics/chapter-index-2/legacy-spreadsheet-controller.md).
# Legacy Spreadsheet / CSV controller
**❗ IMPORTANT**\
This page documents the **legacy** Spreadsheet controller (registered as **General > Spreadsheet**). It is retained so existing projects continue to open. For new projects, use [Tables: Row](/play-and-update-graphics/chapter-index-1/drive-a-graphic-with-tables-row.md) or [Tables: Block](/play-and-update-graphics/chapter-index-1/tables-block-controller.md) — the unified Tables controller reads the same CSV and XLSX files and is the supported path forward.
Captivate can display data from XLSX and CSV files in graphics through the legacy Spreadsheet controller. This page describes how to connect a spreadsheet to a graphic with the legacy controller and how to structure the data files — the file formats also apply to spreadsheets you load through Tables.
## Add a legacy Spreadsheet input
1. In Captivate’s playout interface, open a project (if a project isn’t already open) and select a graphic in the Project List.
**💡 TIP**\
Open the Library panel and drag a title design to your channel first if you don’t have one yet.
2. Click the **Select a Datasource** cell in the Data Controller column and choose **General** > **Spreadsheet** > **New Input**. (The same controller is also registered as **Productivity** > **Spreadsheet** — the workflow is identical.)
**💡 TIP**\
If you previously connected a spreadsheet and want to reuse it, select it from **General** > **Spreadsheets** instead. To remove a Data Controller from a graphic, open the **Preview** panel, click **Link Data**, right-click the controller’s name, and choose **Remove Input**.
3. When prompted, either select an existing file or create a new one:
**Select an existing XLSX or CSV file**
1. Ensure the file is formatted as described in [Create spreadsheet data files](#create-spreadsheet-data-files).
2. Click **Select file**, then find and open the file. The data appears in the Spreadsheet panel.
**Create a new spreadsheet file**
3. Click **New Input**.
4. Enter a descriptive file name and save the file somewhere you will remember. Captivate saves it as a CSV and shows placeholder data based on the graphic’s variables.
5. Open the new file in a spreadsheet or text editor, enter your variable names and values (see below), and save. Captivate picks up the changes automatically.
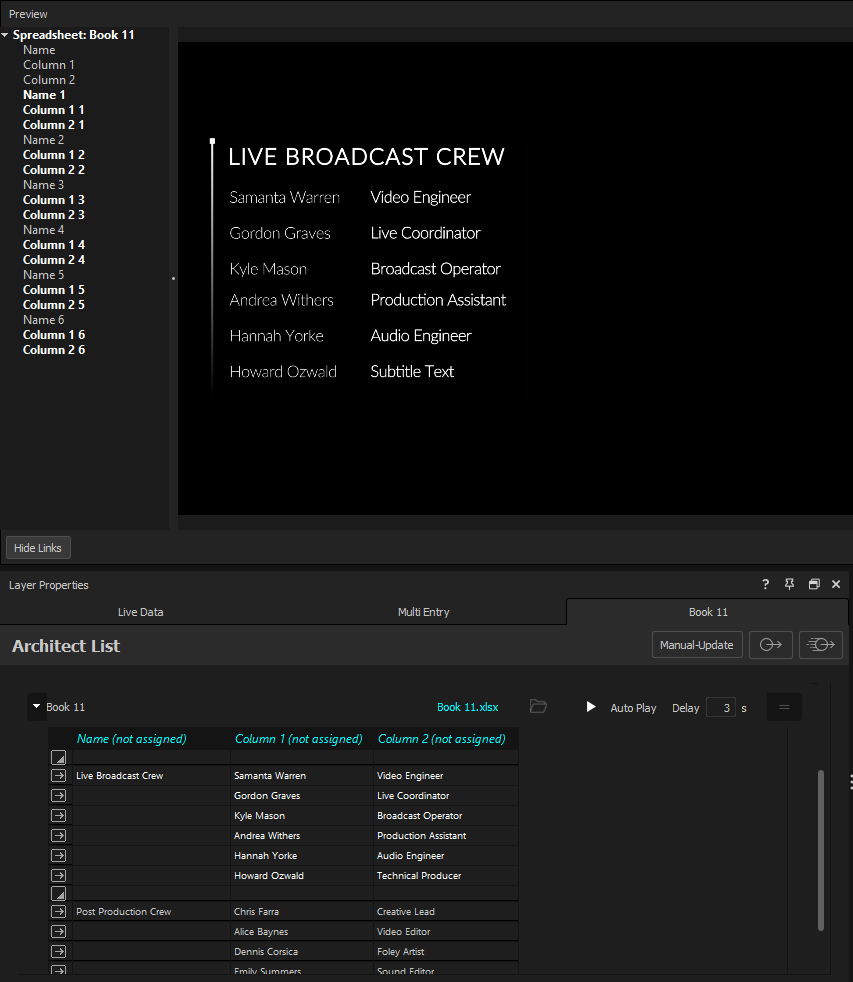
4. Click **Link Data** in the **Preview** panel, then drag a spreadsheet variable onto an element in the graphic. Repeat for each variable you want connected.
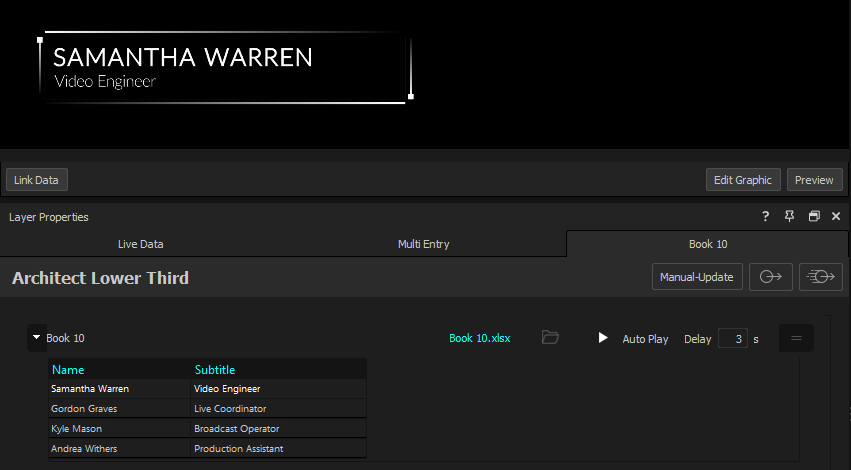
5. Click a line or block of data in the Spreadsheet panel to show that data in the graphic.
## Create spreadsheet data files
Structure the file to match the graphic. Use **basic** data files for designs with few text objects (a lower third) where you show one line at a time. Use **block** data files for graphics with many text objects where you show or hide groups of data together.
### Create basic data files
1. Open an XLSX or CSV file in a spreadsheet editor or text editor.
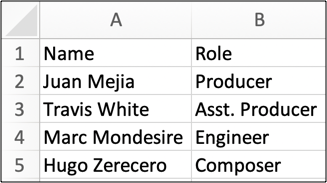
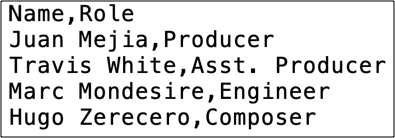
2. On the first line, enter the variable names. In a text editor, separate them with commas — for example, `Name,Role`.
3. On each following line, enter the values for one record — for example, `Juan,Producer`.
**❗ IMPORTANT**\
Don’t include blank lines in basic data files.
Example in a spreadsheet editor:
Example in a text editor:
4. Save the file. If it’s already connected to a graphic, the changes appear in the Spreadsheet panel automatically.
### Create block data files (Broadcast only)
With Captivate Broadcast, create a block data file for graphics with many text objects, or when you need to show or hide multiple lines (blocks) together.
{% hint style="info" %}
Block mode is not supported within Google Sheets.
{% endhint %}
1. Open an XLSX or CSV file.
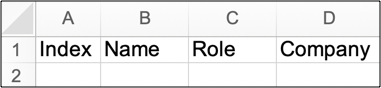
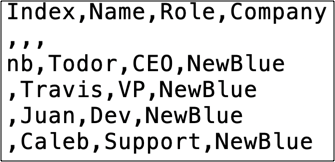
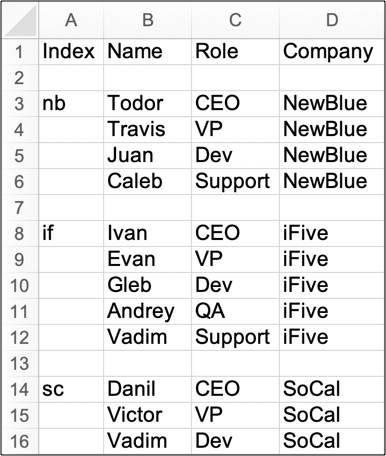
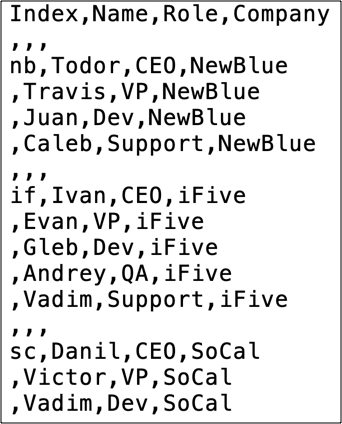
2. On the first line, enter the word **index**, then the variable names — for example, `Index,Name,Role`. The index names blocks of data — you can select a block by that name with [Instant Search](/control-your-show/chapter-index/select-with-instant-search.md) — and it does not appear in the rendered graphic.
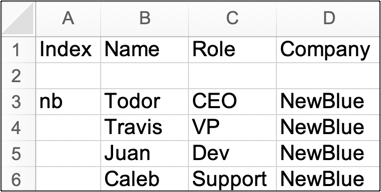
3. On the next line, leave a blank line (or enter three commas, `,,,`, in a text editor).
4. For each block: on the first line after the blank, enter a short name for the index plus the values — for example, `nb,Todor,CEO`. On subsequent lines of the same block, leave the index column empty and enter the values — for example, `,Travis,VP`.
5. To add another block, leave a blank line (or `,,,`) and repeat.
6. Save the file.
### Tip: Add image variables to spreadsheet files
Enter the image’s file name, or its full path and file name:
* Windows: `C:\Documents and Settings\company\images\logo.jpeg`
* macOS: `Macintosh HD/Users/abc/Documents/Images/logo.jpeg`
If you enter only a file name (such as `logo.png`), Captivate looks for it in the **Textures** folder of the installation directory and the project’s directory. Enter the full path for images stored anywhere else.
{% hint style="info" %}
The path must end with the image’s file name and extension or Captivate cannot recognize the image. JPEG has been the most reliable format. If an image displays as a white box, check the path formatting, or move the image into the Textures folder.
{% endhint %}
### Tip: Add color variables to spreadsheet files
Enter a hexadecimal value (for example, `#2F3BE4`) for each color you want to carry as a variable. Connect it to a color variable in the graphic the same way as any other column.
## Operate spreadsheet data during a show
### Select data in basic data files
1. Select the spreadsheet-connected graphic in the Project List to view it in the Preview panel.
2. If the Spreadsheet panel lists more than one spreadsheet input, expand the input that is connected to the graphic you selected.
3. Click a line in the Spreadsheet panel to display that line’s information in the graphic.
### Select and hide data in block data files (Broadcast only)
1. Select the spreadsheet-connected graphic in the Project List to view it in the Preview panel.
2. If the Spreadsheet panel lists more than one spreadsheet input, expand the input that is connected to the graphic you selected.
3. Click anywhere in a block of data in the Spreadsheet panel to display that block in the graphic.
4. To turn specific blocks, lines, or parts of lines off and on (all data is on by default), do any of the following:
* Click the **Block**  button near the top-left corner of a data block to turn the whole block off and on.
* Click the **Line**  button next to a line to turn the line off and on.
* Click a **cell** in a data block to turn that cell off and on.
### Automatically play spreadsheet data
When a graphic is connected to a spreadsheet input with multiple lines or blocks of data, Captivate can display each line or block in succession during playback.
1. If you connected blocks of data and want to hide some of it, turn the unwanted data off first (see the previous section).
2. Click the **Auto Play** button in the Spreadsheet panel for the input connected to the graphic.
3. Enter a number in the **Delay** field — the seconds each line or block displays during playback.
4. Click the **Play** button on the graphic’s row in the Project List. Captivate automatically displays and rotates through each line or block of data in the file.
## Migration to the new Tables controller
If you maintain a project that currently uses **General > Spreadsheet**, you can switch to [Tables: Row](/play-and-update-graphics/chapter-index-1/drive-a-graphic-with-tables-row.md) or [Tables: Block](/play-and-update-graphics/chapter-index-1/tables-block-controller.md) without changing the data file: choose **Productivity > Tables: Row > New Input**, click **Browse** to pick the same XLSX or CSV file, and re-link the variables to your graphic. The Tables grid adds column sorting, header context menus, Auto Refresh, and Google Sheets / Excel Online support that the legacy controller does not.
## See also
* [Legacy data controllers](/play-and-update-graphics/chapter-index-2.md) — chapter overview
* [Tables overview](/play-and-update-graphics/chapter-index-1/tables-overview.md) — the modern Tables controller
* [Legacy JSON controller](/play-and-update-graphics/chapter-index-2/legacy-json-controller.md) and [Legacy XML controller](/play-and-update-graphics/chapter-index-2/legacy-xml-controller.md) — sibling legacy feeds
---
# Agent Instructions
This documentation is published with GitBook. GitBook is the documentation platform designed so that both humans and AI agents can read, navigate, and reason over technical content effectively. Learn more at gitbook.com.
## Querying This Documentation
If you need additional information that is not directly available in this page, you can query the documentation dynamically by asking a question.
Perform an HTTP GET request on the current page URL with the `ask` query parameter, and the optional `goal` query parameter:
```
GET https://captivatehelp.newbluelive.com/play-and-update-graphics/chapter-index-2/legacy-spreadsheet-controller.md?ask=&goal=
```
`ask` is the immediate question: it should be specific, self-contained, and written in natural language.
`goal` is optional and describes the broader end goal you are ultimately trying to accomplish on behalf of the user. GitBook uses it to tailor the answer towards what is most useful for that goal.
The response will contain a direct answer to the question and relevant excerpts and sources from the documentation.
Use this mechanism when the answer is not explicitly present in the current page, you need clarification or additional context, or you want to retrieve related documentation sections.