> For the complete documentation index, see [llms.txt](https://captivatehelp.newbluelive.com/llms.txt). Markdown versions of documentation pages are available by appending `.md` to page URLs; this page is available as [Markdown](https://captivatehelp.newbluelive.com/play-and-update-graphics/chapter-index-2/legacy-google-sheets-controller.md).
# Legacy Google Sheets controller
**❗ IMPORTANT**\
This page documents the **legacy** Google Sheets controller (registered as **Productivity > Google > Sheets**). It is retained so existing projects continue to open. For new projects, use [Tables: Row](/play-and-update-graphics/chapter-index-1/drive-a-graphic-with-tables-row.md) or [Tables: Block](/play-and-update-graphics/chapter-index-1/tables-block-controller.md) — the unified Tables controller opens Google Sheets through **Open URL** or the cloud picker and is the supported path forward.
Captivate can display data from a Google Sheets file in graphics through the legacy Google Sheets controller. This page describes how to link sheet data to a graphic and play out rows.
## Connect Google Sheets data to a graphic
1. In Captivate’s playout interface, open a project (if a project isn’t already open) and select a graphic in the Project List.
2. Click the **Select a Datasource** cell in the Data Controller column and choose **Productivity** > **Google** > **Sheets** > **New Input**.
**💡 TIP**\
To remove an input from a graphic, open the **Preview** panel, click **Link Data**, right-click the data source name, and choose **Remove input**.
**📌 NOTE**\
Multiple graphics can read from the same Google Sheets file — separate tabs of one workbook, for instance. Playing out or in from the Google Sheets controller panel affects **all** connected graphics, so use the play controls in the Project List instead when you share a file this way.
3. Sign in to your Google account. First-time sign-in goes through **Settings** > **Internet Accounts**; once signed in, the controller uses that account without prompting again.
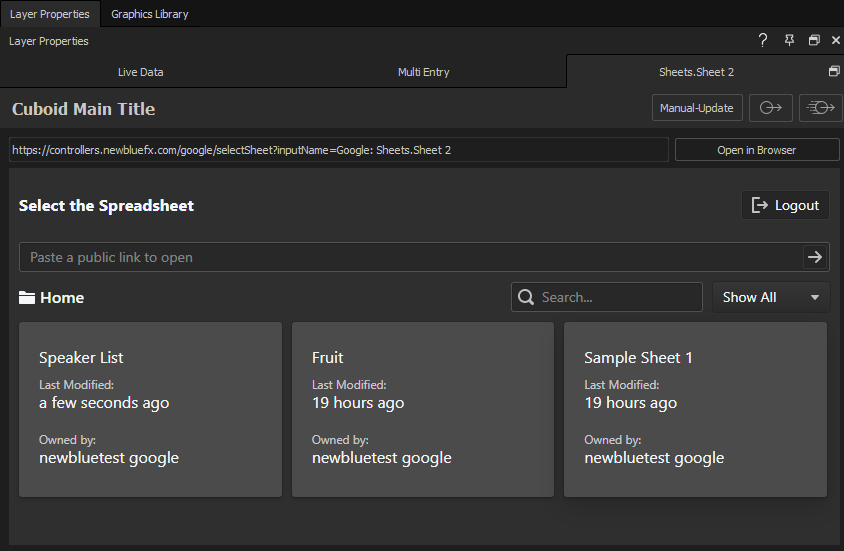
4. The controller’s tab in the Properties panel displays the folders from your Google Drive that contain sheets. Browse to the sheet you want to connect.
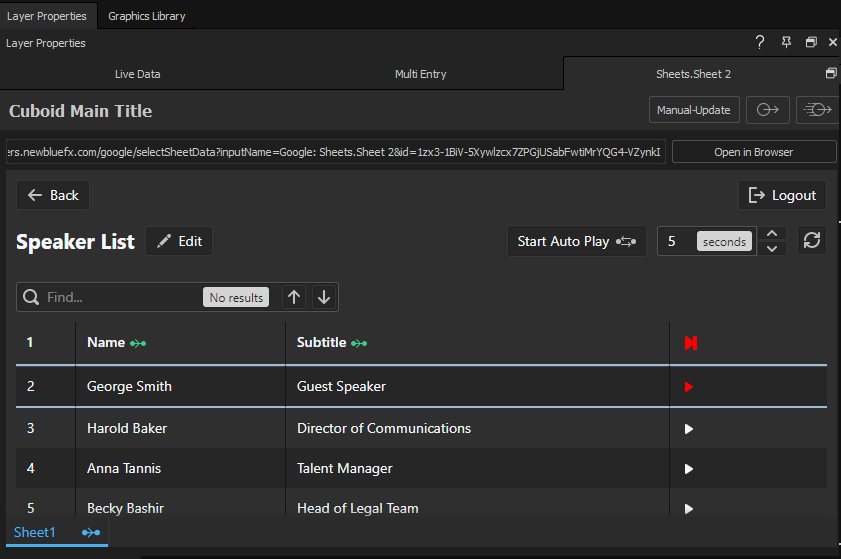
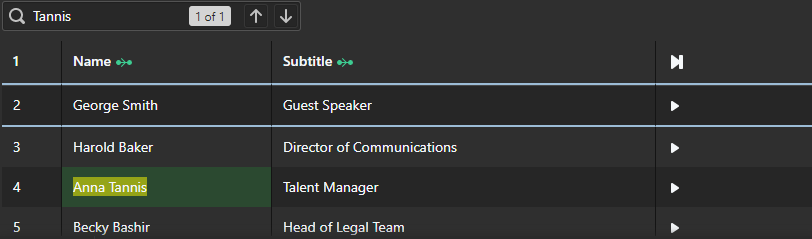
5. Selecting a sheet displays all its rows. This interface is where you control and play out data rows.
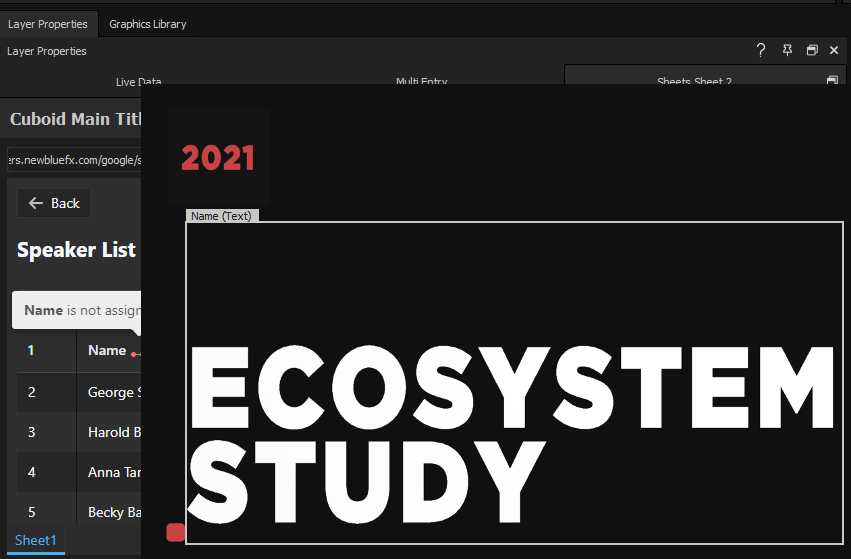
6. Click the red icons to link data columns. A preview of your graphic opens — hovering over variable-enabled elements shows a bounding box with the variable’s name and type. Click an element to link the column to that variable.
**❗ IMPORTANT**\
Variable names do not have to match data column names for a link to be established.
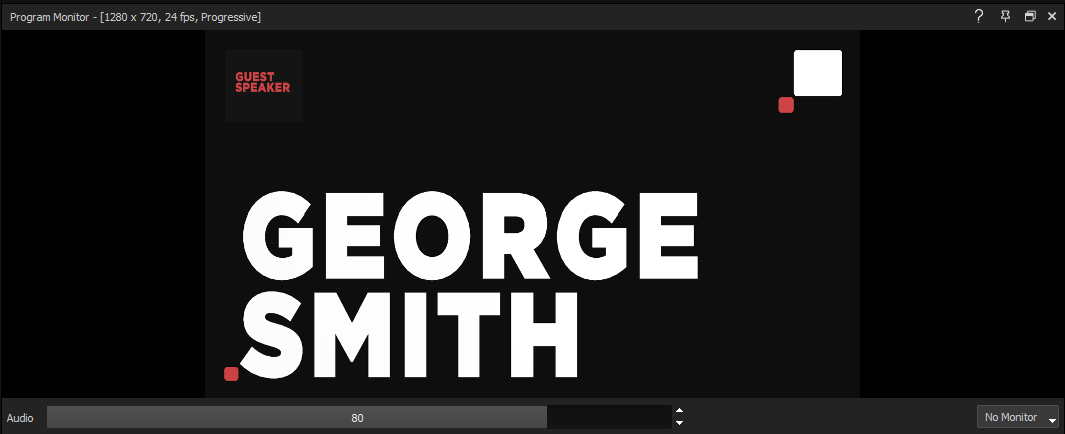
7. Linked columns show a green link icon. Rows of the sheet now behave as instances of data: clicking the play button on any row updates the graphic with that row’s information.
**💡 TIP**\
Use the **Find** search tool to quickly locate information in your sheet. Matching keywords highlight the cells where that information exists.
{% hint style="info" %}
If the connected sheet has been edited, use the refresh button to pull the changes into Captivate. The controller polls Google Sheets every 30 seconds for changes.
{% endhint %}
## Playout controls
### Start Auto Play
The controller can play through each row of your sheet automatically while the graphic is live. The **Start Auto Play** button toggles the feature; the setting to its right sets the delay in seconds before the next row displays. Linked elements animate out before the next set of information animates in.
### Manual playout
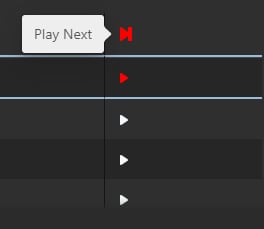
The far-right columns of the sheet handle manual playout. The top **Play next** icon plays the next line — select the second row, click **Play next**, and the third row plays.
Clicking the play button on any row plays that row. Clicking play on another row queues the previous row to animate out before the selected row animates in.
## Migration to the new Tables controller
To move a project to the modern path, add a [Tables: Row](/play-and-update-graphics/chapter-index-1/drive-a-graphic-with-tables-row.md) input, open the same Google Sheet through **Open URL** (paste the sheet’s link) or the cloud picker after signing in, and re-link the columns to your graphic. Tables adds column sorting, header context menus, and configurable Auto Refresh.
## See also
* [Legacy data controllers](/play-and-update-graphics/chapter-index-2.md) — chapter overview
* [Legacy Microsoft Excel controller](/play-and-update-graphics/chapter-index-2/legacy-microsoft-excel-controller.md) — the OneDrive sibling
* [Tables overview](/play-and-update-graphics/chapter-index-1/tables-overview.md) — the modern Tables controller
---
# Agent Instructions
This documentation is published with GitBook. GitBook is the documentation platform designed so that both humans and AI agents can read, navigate, and reason over technical content effectively. Learn more at gitbook.com.
## Querying This Documentation
If you need additional information that is not directly available in this page, you can query the documentation dynamically by asking a question.
Perform an HTTP GET request on the current page URL with the `ask` query parameter, and the optional `goal` query parameter:
```
GET https://captivatehelp.newbluelive.com/play-and-update-graphics/chapter-index-2/legacy-google-sheets-controller.md?ask=&goal=
```
`ask` is the immediate question: it should be specific, self-contained, and written in natural language.
`goal` is optional and describes the broader end goal you are ultimately trying to accomplish on behalf of the user. GitBook uses it to tailor the answer towards what is most useful for that goal.
The response will contain a direct answer to the question and relevant excerpts and sources from the documentation.
Use this mechanism when the answer is not explicitly present in the current page, you need clarification or additional context, or you want to retrieve related documentation sections.