> For the complete documentation index, see [llms.txt](https://captivatehelp.newbluelive.com/llms.txt). Markdown versions of documentation pages are available by appending `.md` to page URLs; this page is available as [Markdown](https://captivatehelp.newbluelive.com/design-and-customize-graphics/chapter-index-6/linking-data-to-after-effects-designs.md).
# Link data to After Effects designs
Captivate gives you the ability to link data to your After Effects designs with the same process as your Designer graphics. If you would like more specific detail on each Data Controller please see the Connect Data to Graphic Layers section. See below for a general workflow to connect a data source.
This feature is only available in Captivate Broadcast.
## Linking an external data source
You may link any of Captivate’s Data Controllers to your After Effects designs. For a list of the types of variables that are supported in `.aep` and `.mogrt` layers, please refer to [Preparing Your After Effects Designs for Import](/design-and-customize-graphics/chapter-index-6/preparing-your-after-effects-designs-for-import.md).
1. Import your After Effects design into Captivate.
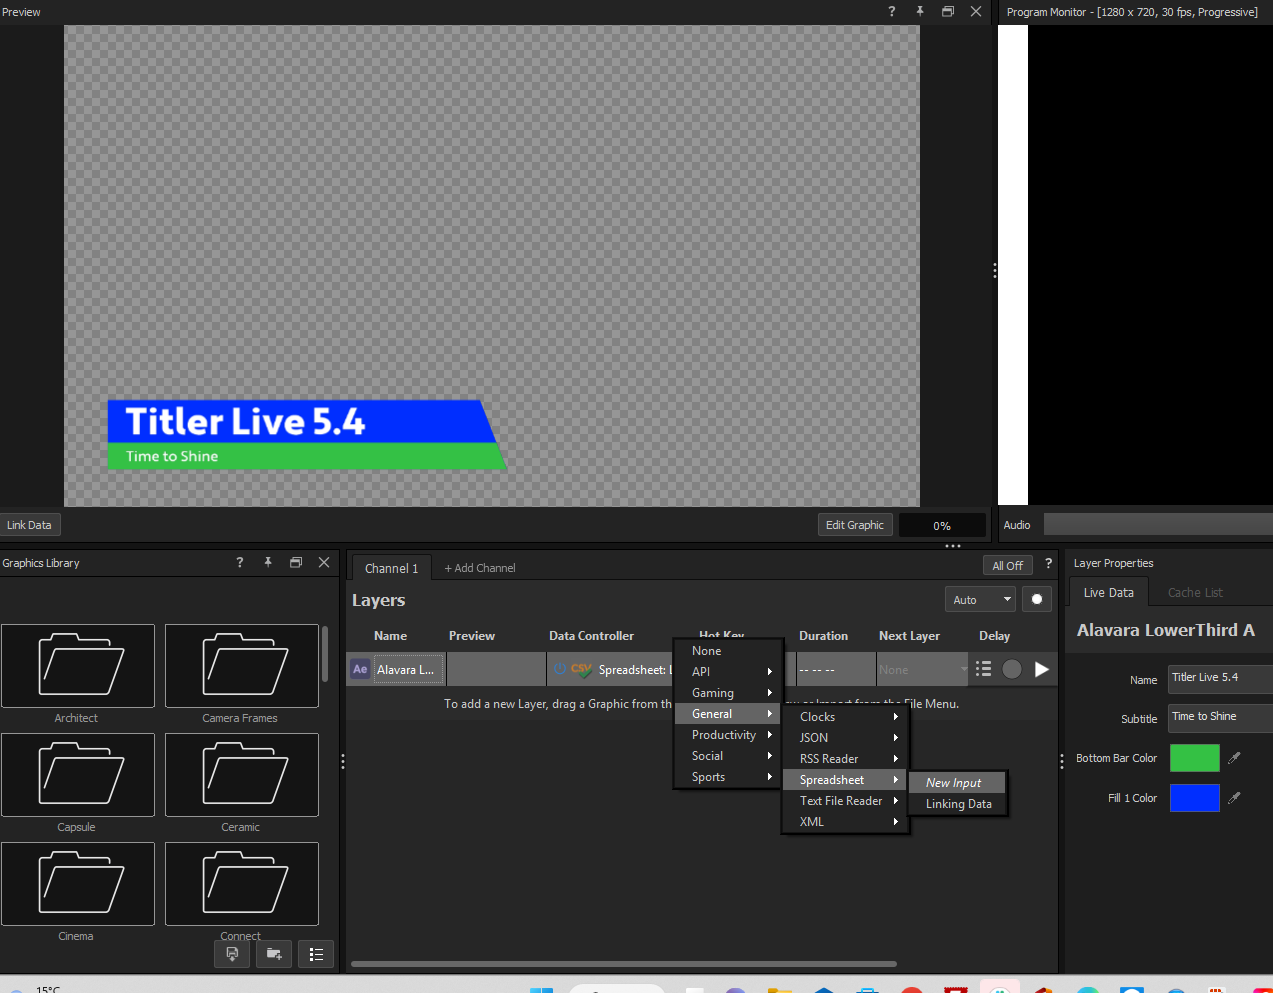
2. Select a Data Controller under the Data Controller column in your Graphic Layers panel.
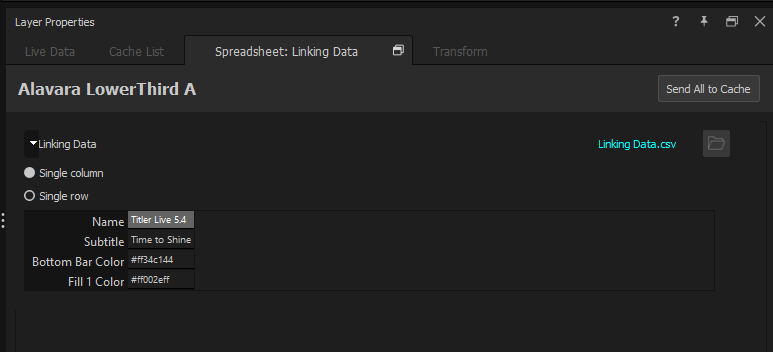
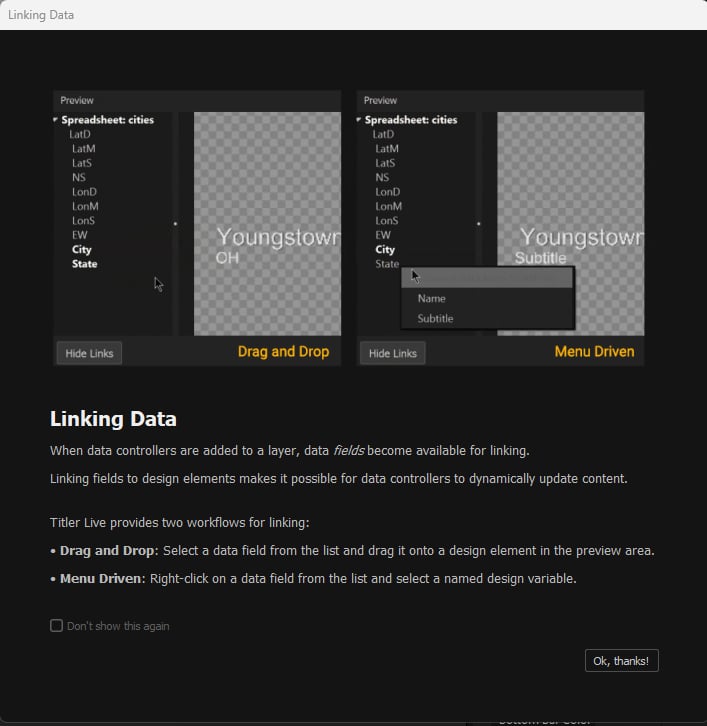
3. When Data Controllers are added to a layer, the Data Controller will open in its own tab in the Layer Properties panel and data fields become available for linking. You now have the option to view data in a single column:
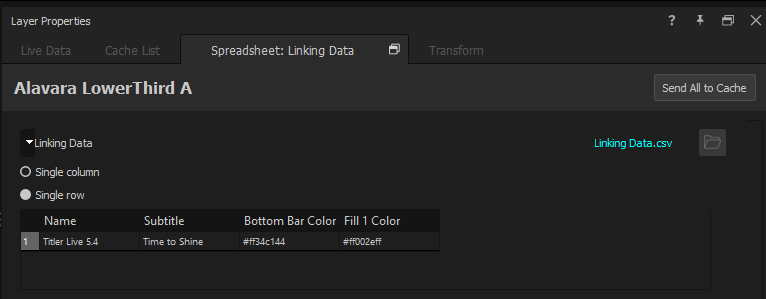
or a single row:
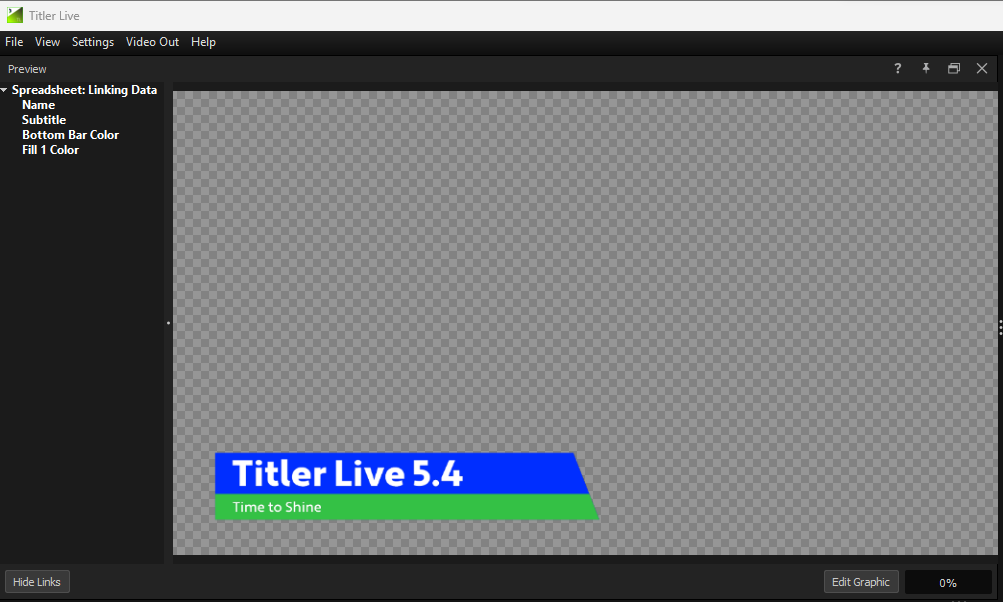
4. Select **Link Data** in the Preview panel to display the various data fields from the Data Controller.
5. Select a data field from the list and drag it to a design element in the preview area.
Or: right-click the data field from the list and select a named design variable.
**📌 NOTE**\
If your graphic has nested comps, the bounding boxes for the various properties in the graphic may not be drawn correctly. In this event, we recommend using the right-click workflow.
6. After changes are rendered and the Preview button is available, test to ensure the graphics are connected correctly.
Your graphic will automatically render and display the newly connected data. You may wish to use our pre-cache workflow to limit on-air rendering. For more information, see [Pre-cache graphics before a show](/control-your-show/chapter-index/pre-cache-graphics-before-a-show.md).
**💡 TIP**\
Double-clicking an object in the Preview panel will reset all scale and position values to their defaults.
---
# Agent Instructions
This documentation is published with GitBook. GitBook is the documentation platform designed so that both humans and AI agents can read, navigate, and reason over technical content effectively. Learn more at gitbook.com.
## Querying This Documentation
If you need additional information that is not directly available in this page, you can query the documentation dynamically by asking a question.
Perform an HTTP GET request on the current page URL with the `ask` query parameter, and the optional `goal` query parameter:
```
GET https://captivatehelp.newbluelive.com/design-and-customize-graphics/chapter-index-6/linking-data-to-after-effects-designs.md?ask=&goal=
```
`ask` is the immediate question: it should be specific, self-contained, and written in natural language.
`goal` is optional and describes the broader end goal you are ultimately trying to accomplish on behalf of the user. GitBook uses it to tailor the answer towards what is most useful for that goal.
The response will contain a direct answer to the question and relevant excerpts and sources from the documentation.
Use this mechanism when the answer is not explicitly present in the current page, you need clarification or additional context, or you want to retrieve related documentation sections.