> For the complete documentation index, see [llms.txt](https://captivatehelp.newbluelive.com/llms.txt). Markdown versions of documentation pages are available by appending `.md` to page URLs; this page is available as [Markdown](https://captivatehelp.newbluelive.com/design-and-customize-graphics/chapter-index-5/leaderboard-conductor.md).
# Leaderboard Conductor
> *Availability — included in Broadcast and Enterprise. Available for Sport as the Leaderboards add-on.*
A Leaderboard Conductor turns one designed row into a fixed list of N rows that share the same template. Each row is fed by a connected data source — usually a Tables sheet — and rows animate to new positions when the data tells them to re-rank. Use a Leaderboard whenever you need a scoreboard, a points table, or any "top N" list where every slot is always on screen.
A Leaderboard Conductor is **not** the same thing as the **Leaderboards** menu family in the Data Controller. The Data Controller publishes rows; this article is about the graphic-side container that receives them.
## Designer Setup
You build a Leaderboard Conductor by wrapping one designed row (a group of layers) in a conductor. The conductor then clones the row into N copies, lays them out, and lets a data source fill each copy.
1. In Captivate’s playout interface, select the graphic in the Project List, then click the **Edit Graphic** button in the Preview panel to open the Designer.
2. Build **one row** of the leaderboard. Add the design layers you need — a position number, a player or team name, a score, a logo — and arrange them as the row should look.
3. Select all the layers that make up the row, right-click in the canvas (or in the Timeline panel) and choose **Create Conductor** > **Leaderboard**. This combines the layers into one group, embeds the group in a Leaderboard Conductor, and clones it into the default number of rows, laid out vertically below the original.
If the **Create Conductor** menu is missing, your license doesn’t include the Leaderboard conductor; check your entitlements with NewBlue support.
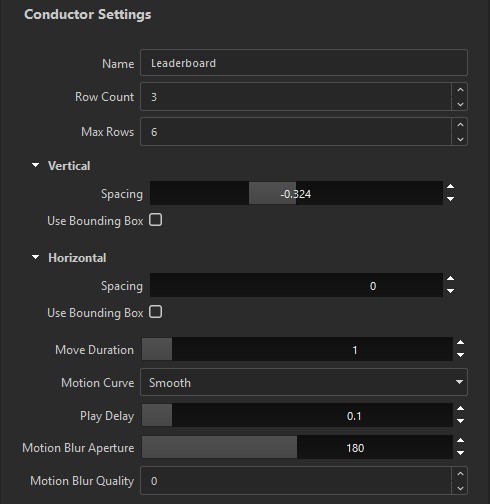
4. Click anywhere on the conductor in the canvas to select it. The Properties panel’s **Conductor** tab shows the conductor’s design-time settings — row count, layout, and animation.
{% hint style="info" %}
The conductor’s row template is the original group you wrapped. If you change anything in that group — add a layer, change a font — the change applies to every cloned row. To redesign a single row in isolation, ungroup the conductor first.
{% endhint %}
When the conductor is built, commit your changes with the green checkmark and return to the playout interface. You connect the data source there, not in the Designer — see [Tables: Block Controller](/play-and-update-graphics/chapter-index-1/tables-block-controller.md).
## Properties
A Leaderboard Conductor’s settings appear in two places:
* **In the Designer**, when you select the Leaderboard Conductor instance inside the title, the Properties panel shows a **Conductor** tab with **all** settings — including design-time-only fields like Max Rows, layout spacing, and bounding-box options that don’t appear at playout time.
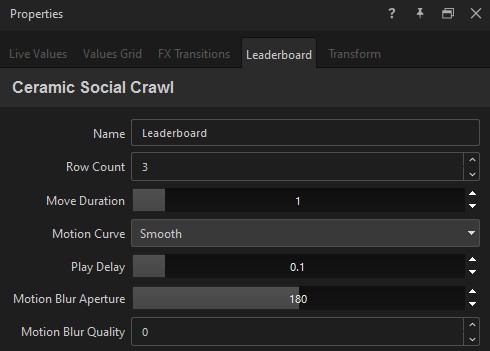
* **In the playout main view**, when you select the title that contains the Leaderboard Conductor, the title’s Properties shows a **Leaderboard** tab with the runtime-tunable subset (Row Count, Move Duration, Motion Curve, Play Delay, Motion Blur).
Fields marked *(Designer only)* below appear only in the Designer view.
### Name
The name your data source uses to address the conductor. The default is **Leaderboard**. If you rename it to, for example, **TopScores**, your data source must address its conductor parameters as `TopScores.Row Count` instead of `Leaderboard.Row Count`. Per-row variable names (`1.Name`, `2.Score`, etc.) are not affected by the conductor name.
Give each conductor a unique name when a graphic holds more than one of the same type — that’s how their data and parameters stay separate. You set the name here in the Designer; in the playout Properties it’s read-only.
### Row Count
How many rows the leaderboard displays. Default **4**. Range **1**–**40**. Effective row count is capped by **Max Rows** below.
**Row Count** controls how many rows are **on screen**; **Max Rows** controls how many rows **exist**. Data pushed to a row above the current **Row Count** isn’t discarded — the row holds its values out of sight and shows them if you raise **Row Count** later. That’s what lets you push a full field of results and reveal the top three, then the top five, without sending the data again. If your source pushes fewer rows than **Row Count**, the extra slots stay empty.
**Changing Row Count on air.** You can raise or lower **Row Count** while the leaderboard is on program and the change takes effect straight away — there’s no need to take the graphic down and bring it back. New rows animate in, departing rows animate out, and the rows that remain move to their new positions over **Move Duration**.
### Max Rows *(Designer only)*
How many rows the leaderboard has in total, displayed or not. Default **6**. Range **1**–**20**. This sizes the per-row variables (`1.**`, `2.**`, …) your data source can address, and sets the ceiling for **Row Count** — the leaderboard never shows more rows than **Max Rows**, however high **Row Count** is set.
Set **Max Rows** to the largest field you expect to receive, then drive **Row Count** to choose how much of it is visible.
### Vertical → Spacing *(Designer only)*
Vertical distance between rows when **Use Bounding Box** is off. Default **0.100**. Range **-1.000** to **1.000**, step **0.001**.
The value is a fraction of the project frame’s height. Negative values let rows overlap.
### Vertical → Use Bounding Box *(Designer only)*
When on, rows are distributed to fill the conductor’s bounding box vertically and **Vertical → Spacing** is ignored. Default **off**.
### Horizontal → Spacing *(Designer only)*
Horizontal offset between rows. Default **0.000**. Range **-1.000** to **1.000**, step **0.001**.
Use this when you want the rows to step diagonally (e.g., a stair-step podium layout). Most leaderboards leave this at 0 and rely solely on **Vertical → Spacing**.
### Horizontal → Use Bounding Box *(Designer only)*
When on, rows are distributed to fill the conductor’s bounding box horizontally and **Horizontal → Spacing** is ignored. Default **off**.
### Move Duration
Seconds to animate a row to its new slot when the data source pushes a re-rank. Default **1.00**. Range **0.00**–**10.00**, step **0.10**.
Set to 0 for instant re-ranking with no animation. The animation runs only while the title is actively playing — preview and snapshot frames always snap to the final position.
### Motion Curve
Easing curve applied to row movement when **Move Duration** > 0. Default **Smooth**. Choices:
* **Instant** — no easing
* **Smooth** — accelerates and decelerates (S-curve)
* **Linear** — constant speed
* **Accelerate** — starts slow, ends fast
* **Decelerate** — starts fast, ends slow
### Play Delay
Per-row stagger on play-in. Default **0.1000**. Range **0.0000**–**1.0000**, step **0.001**.
Row 1 starts at the title’s play-in time; row 2 starts `Play Delay` seconds later; row N starts `(N-1) × Play Delay` seconds later. The title’s play-out start is automatically pushed back by `(N-1) × Play Delay` so the last row gets a full lifetime.
Set to 0 for all rows to play in simultaneously.
### Motion Blur Aperture
Shutter angle in degrees applied to motion blur during row reorder animation. Default **180**. Range **0**–**360**, step **1**, no decimals.
* **0** — no motion blur
* **180** — cinema standard
* **360** — maximum blur
Motion blur only renders when **Motion Blur Quality** is greater than 0.
### Motion Blur Quality
Iteration count for the motion-blur sampler. Default **0** (off). Range **0**–**6**, step **1**.
Higher values produce smoother blur at higher render cost. Leave at 0 unless reorder animation is fast enough that you can see stepping.
### Hidden per-row variable: Order
Each row instance has a hidden variable named **Order** (`1.Order`, `2.Order`, …). Your data source writes a sortable value (typically a number) into each `Order` variable, and the conductor sorts rows by ascending `Order` value, animating each row to its new slot. Without `Order` values the row order is undefined.
## See also
* [Tables: Block Controller](/play-and-update-graphics/chapter-index-1/tables-block-controller.md) — the most common data source for a Leaderboard Conductor.
* [Leaderboard Controller](/play-and-update-graphics/chapter-index-1/leaderboard-controller.md) — Sports-menu variant of the same controller.
* [Crawl Conductor](/design-and-customize-graphics/chapter-index-5/crawl-conductor.md)
* [Roll Conductor](/design-and-customize-graphics/chapter-index-5/roll-conductor.md)
---
# Agent Instructions
This documentation is published with GitBook. GitBook is the documentation platform designed so that both humans and AI agents can read, navigate, and reason over technical content effectively. Learn more at gitbook.com.
## Querying This Documentation
If you need additional information that is not directly available in this page, you can query the documentation dynamically by asking a question.
Perform an HTTP GET request on the current page URL with the `ask` query parameter, and the optional `goal` query parameter:
```
GET https://captivatehelp.newbluelive.com/design-and-customize-graphics/chapter-index-5/leaderboard-conductor.md?ask=&goal=
```
`ask` is the immediate question: it should be specific, self-contained, and written in natural language.
`goal` is optional and describes the broader end goal you are ultimately trying to accomplish on behalf of the user. GitBook uses it to tailor the answer towards what is most useful for that goal.
The response will contain a direct answer to the question and relevant excerpts and sources from the documentation.
Use this mechanism when the answer is not explicitly present in the current page, you need clarification or additional context, or you want to retrieve related documentation sections.