> For the complete documentation index, see [llms.txt](https://captivatehelp.newbluelive.com/llms.txt). Markdown versions of documentation pages are available by appending `.md` to page URLs; this page is available as [Markdown](https://captivatehelp.newbluelive.com/design-and-customize-graphics/chapter-index-4/connect-data-from-multiple-sources.md).
# Connect data from multiple sources to one graphic
Most Captivate products can display data from multiple sources in one graphic, including sports databases, game clocks, news feeds, and more. Currently in Captivate, when you first create an input with a Data Controller (like a JSON file for example) it automatically replaces the current Data Controller. But once all inputs are already created you will be given an option to combine them. Refer to the steps below to assign multiple data sources to the same graphic layer.
* [Connect Multiple Data Controllers](#connect-multiple-data-controllers)
* [Assign Variables to your Graphic Layers](#assign-variables-to-your-graphic-layers)
## Connect Multiple Data Controllers
1. In Captivate’s playout interface, open a project (if a project isn’t already open) that includes a graphic that you want to connect to multiple data sources.
**💡 TIP**\
Want to create a new graphic? Open the Library panel and drag a design from the library to the Project List.
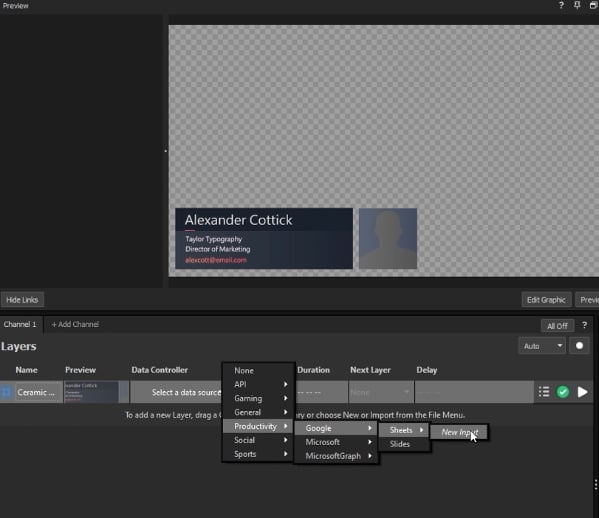
2. Select your first data source (e.g., Google Sheets, Spreadsheet, JSON, XML, etc.) > **Select new input**.
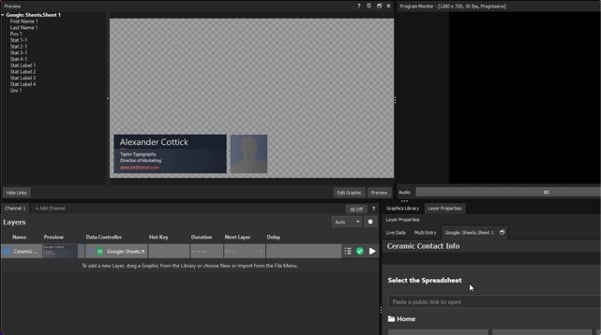
You should see the type of selected data source register in the Layer Properties Panel but no file attached. If it prompts you to choose a file, you can choose again in a later step.
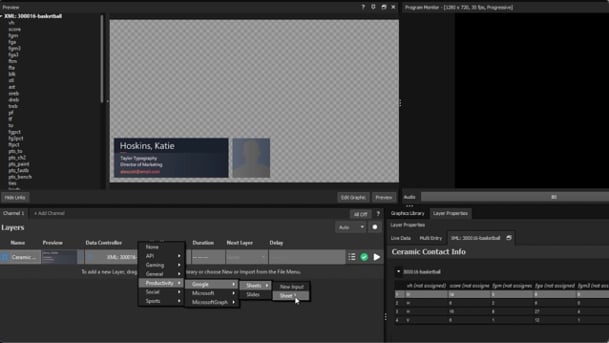
3. Connect your second data source (e.g., Google Sheets, Spreadsheet, JSON, XML, etc.) > **Select new input**.
4. Repeat for any additional data sources you want to connect to your graphic.
5. Navigate to the Data Controller dropdown, then select the input file that is labeled and listed under **New Input** and select the file if prompted.
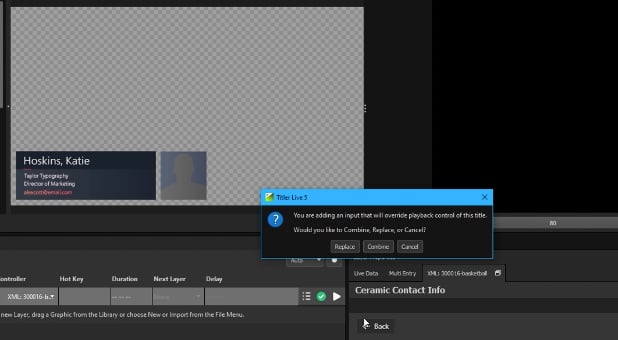
6. This will prompt a dialog box asking if you would like to **Combine**, **Replace**, or **Cancel**. Select **Combine**.
7. Select the second input you created and attach the file.
8. Repeat for all additional data sources connected.
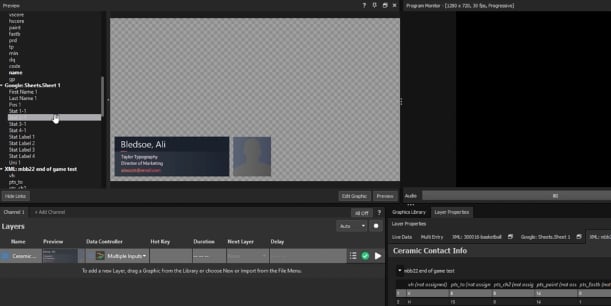
You should now see all of your data sources in the Show Links sidebar of the Preview Panel, ready to connect to your variables in the graphic. Each data source is also assigned a separate tab in the Layer Properties Panel.
## Assign Variables to your Graphic Layers
1. Open the list of variables connected through the data source by clicking the **Link Data** button in the **Preview** panel to view the data variables. (If the variables aren’t visible, expand the controller’s list.)
2. Click and drag a variable onto an object in the graphic. Repeat this step for each variable that you want to include in the graphic.
**💡 TIP**\
To remove an input from a graphic layer, navigate to the **Preview** panel. Click the link data button, then right-click on the data source name and choose **Remove input**.
When you broadcast the graphic, data from all data sources is automatically updated just like any graphic that is connected to one data source.
---
# Agent Instructions
This documentation is published with GitBook. GitBook is the documentation platform designed so that both humans and AI agents can read, navigate, and reason over technical content effectively. Learn more at gitbook.com.
## Querying This Documentation
If you need additional information that is not directly available in this page, you can query the documentation dynamically by asking a question.
Perform an HTTP GET request on the current page URL with the `ask` query parameter, and the optional `goal` query parameter:
```
GET https://captivatehelp.newbluelive.com/design-and-customize-graphics/chapter-index-4/connect-data-from-multiple-sources.md?ask=&goal=
```
`ask` is the immediate question: it should be specific, self-contained, and written in natural language.
`goal` is optional and describes the broader end goal you are ultimately trying to accomplish on behalf of the user. GitBook uses it to tailor the answer towards what is most useful for that goal.
The response will contain a direct answer to the question and relevant excerpts and sources from the documentation.
Use this mechanism when the answer is not explicitly present in the current page, you need clarification or additional context, or you want to retrieve related documentation sections.