> For the complete documentation index, see [llms.txt](https://captivatehelp.newbluelive.com/llms.txt). Markdown versions of documentation pages are available by appending `.md` to page URLs; this page is available as [Markdown](https://captivatehelp.newbluelive.com/control-your-show/chapter-index/values-grid.md).
# Values Grid
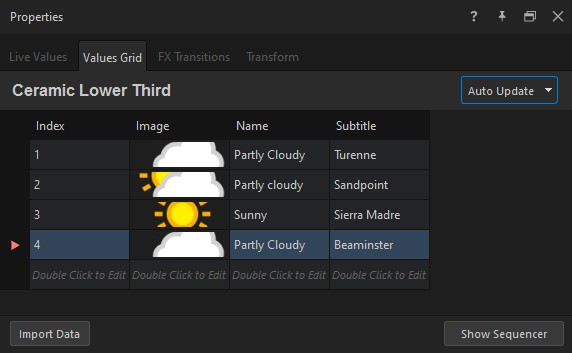
The Values Grid tab in the Properties panel is a spreadsheet view that holds multiple sets of variable values for the same graphic. Each column maps to a variable on the graphic layer; each row is one snapshot of those values. Stack rows for repeatable playout — different speakers in one lower third, different sponsors in one bug, different players in one intro card — and play any row by clicking its row-number header at the left edge.
For the single-instance variable editor (one set of values, no rows), see [Live Values tab](/control-your-show/chapter-index/live-data-tab.md). The two tabs share the same field types (text, color, gradient, image/video, live video, data graph) but use different mechanics; this article documents the grid-specific surface.
* [Use the grid](#use-the-grid)
* [Work with rows](#work-with-rows)
* [Use the Values Grid Sequencer](#use-the-values-grid-sequencer)
* [Import Data](#import-data)
## Use the grid
1. In Captivate’s playout interface, open a project and select a graphic layer from the Project List.
2. The Properties panel will open, which includes the Values Grid tab and all variables that are available for the selected graphic layer.
**📌 NOTE**\
You can change the names of variables when you create variables in the Designer; therefore, the names of variables from your own custom graphics may be different from the names shown in this article’s illustrations.
3. The header cells at the top of the table are the variables that the graphic layer contains. Every cell below it is an instance of that variable. Every row that is composed of these cells will behave as an instance for the graphic layer.
4. Click any row’s row-number header to play that row’s values on air. If the graphic layer is already on air, the values update live and the design layers play their **Update** animations to show the change.
5. Edit a cell by double-clicking it. The edit shows in the Preview panel first; with **Auto Update** on, it goes to Program only when the edited row is already on air. That means you can type new values into the next row while another row plays — nothing airs until you play the edited row.
**💡 TIP**\
Values Grid avoids duplicating the same graphic multiple times — all the possible instances of that graphic can live in one tab as rows.
{% hint style="info" %}
The variable fields in the **Live Values** tab show the values from the row most recently played from Values Grid.
{% endhint %}
## Work with rows
The left edge of the grid is a column of row-number cells. Each row-number cell is both an indicator (shows whether the row is on air) and a play button (click to play that row). The on-air marker follows every live path — a row-header click, the Take button, or the sequencer — so the gutter always points at the row that is actually on air.
Right-click on a row-number cell to open the row context menu:
* **Insert Row Above** — adds a blank row above the one you clicked. Fill in the cells, then play it.
* **Remove Row** — deletes the row.
To add a row from the current **Live Values** state, open the **Live Values** tab and click **Add to Values Grid**. The current values become a new row at the bottom of the grid.
## Use the Values Grid Sequencer
The Values Grid Sequencer walks rows on a timer instead of waiting for you to click each one. Use it for unattended segments — auto-rotating sponsor cards, looping fact-of-the-day inserts, between-segment slides.
1. Click **Show Sequencer** at the bottom of the Values Grid tab. The sequencer panel appears.
2. Build the sequence:
* Select one or more rows in the grid, then click **Add to Sequence** in the sequencer panel.
* Use **Remove from Sequence** to drop rows you no longer want.
3. Pick **Play Mode** — how the sequencer walks the rows:
* **Row Order** — play the rows in grid order, once, then stop.
* **Row Order Looping** — play the rows in grid order, and loop back to the first row after the last.
* **Seq Order** — play the rows in the order they were added to the sequence, once, then stop.
* **Seq Order Looping** — play the rows in sequence-add order, and loop.
4. Set **Interval** — the dwell time on each row, in seconds.
5. Click **Sequencing Off** to switch it on. The button label changes to **Sequencing On** and the timer starts. Click again to stop.
When **Sequencing On** is active, rows advance automatically; clicking a row-number header still works and overrides the sequencer’s next selection.
## Import Data
The **Import Data** button loads rows from a CSV, XLSX, XML, or JSON file into the grid.
**❗ IMPORTANT**\
**Import Data** replaces every row currently in the grid. There is no append option and no confirmation prompt. Save any rows you want to keep before importing.
## Field types
The Values Grid uses the same field types as the **Live Values** tab. See [Live Values tab](/control-your-show/chapter-index/live-data-tab.md) for the reference on Text, Colors, Gradients, Images and pre-recorded videos (including **Design Default** / **Fill** / **Fit** / **Stretch** fit modes), Live videos, and Data graph variables.
A **Media File** column renders like an image column: each cell shows a preview thumbnail (for a video file, a frame from a few seconds in), and double-clicking the cell opens the **Choose Media** picker, which lists video files first. The stored value is the file’s plain path.
## Related
* [Live Values tab](/control-your-show/chapter-index/live-data-tab.md) — the single-instance editor for the same field types.
* [Values Grid tab reference](/get-started/chapter-index-2/values-grid-tab-reference.md) — the panel-controls reference.
* [Prepare multiple variations](/play-and-update-graphics/chapter-index/3-prepare-variations.md) — the introductory tutorial that walks Values Grid end to end.
---
# Agent Instructions
This documentation is published with GitBook. GitBook is the documentation platform designed so that both humans and AI agents can read, navigate, and reason over technical content effectively. Learn more at gitbook.com.
## Querying This Documentation
If you need additional information that is not directly available in this page, you can query the documentation dynamically by asking a question.
Perform an HTTP GET request on the current page URL with the `ask` query parameter, and the optional `goal` query parameter:
```
GET https://captivatehelp.newbluelive.com/control-your-show/chapter-index/values-grid.md?ask=&goal=
```
`ask` is the immediate question: it should be specific, self-contained, and written in natural language.
`goal` is optional and describes the broader end goal you are ultimately trying to accomplish on behalf of the user. GitBook uses it to tailor the answer towards what is most useful for that goal.
The response will contain a direct answer to the question and relevant excerpts and sources from the documentation.
Use this mechanism when the answer is not explicitly present in the current page, you need clarification or additional context, or you want to retrieve related documentation sections.