> For the complete documentation index, see [llms.txt](https://captivatehelp.newbluelive.com/llms.txt). Markdown versions of documentation pages are available by appending `.md` to page URLs; this page is available as [Markdown](https://captivatehelp.newbluelive.com/control-your-show/chapter-index/live-data-tab.md).
# Live Values tab
{% hint style="info" %}
The tab is labeled **Live Values** in the shipping UI. The page URL retains the legacy name `live-data-tab` for backward compatibility.
{% endhint %}
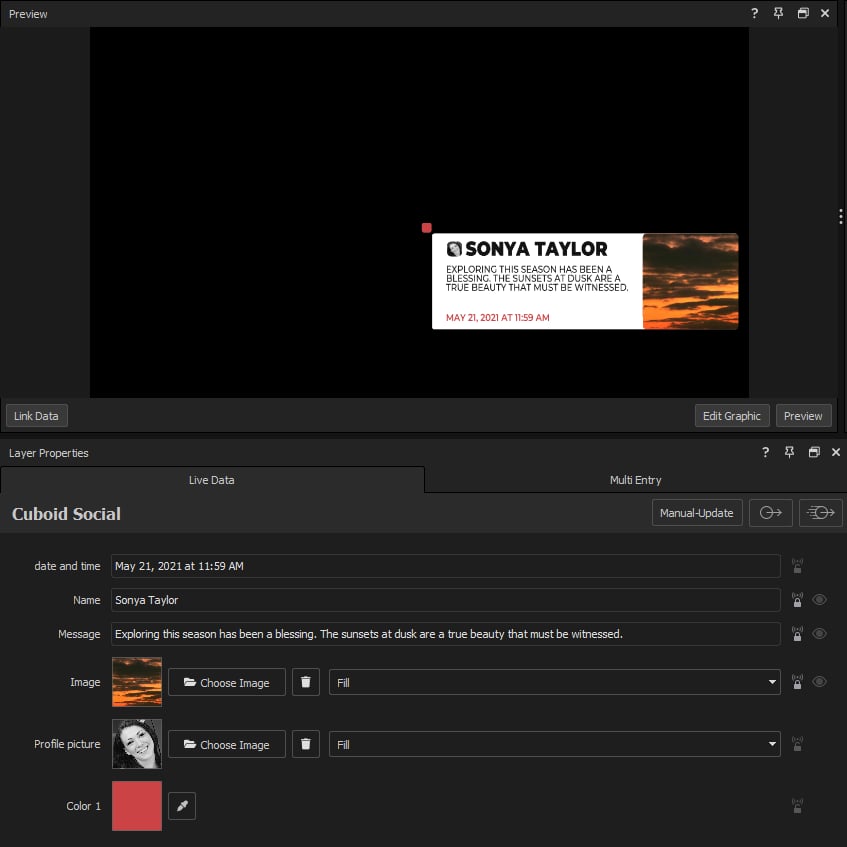
Graphics from Captivate’s Graphics Library, and other graphics you may have created, include variables for content which allows you to customize the videos, images, color, gradients, and text. These same variables can also be updated when linked to a data source.
The Live Values tab in the Layer Properties panel exposes a list of variables for the selected graphic layer. Variables vary depending on which inputs were enabled for that graphic in the Designer. For the spreadsheet view that stores multiple sets of variable values for the same graphic, see [Values Grid](/control-your-show/chapter-index/values-grid.md).
* [Live Values](#live-values)
* [Show All Variables](#show-all-variables)
* [List of variables](#list-of-variables)
## Live Values
The Live Values tab allows you to edit variables for a single instance of the graphic layer. Any edits in this tab continuously update your graphic layer as variables are customized.
1. In Captivate’s playout interface, open a project and select a graphic layer from the Project List.
**💡 TIP**\
Want to create a new graphic? Open the Graphics Library panel and drag a design from the library to the Project List, or choose **File** > **New Graphic**.
2. The Layer Properties panel will open, which includes the Live Values tab and all variables that are available for the selected graphic layer.
3. If you want to connect the graphic layer to a data source and automatically drive data to variables from that graphic layer, see the Connect Data to Graphic Layers section.
4. If you want to manually update the default values in variables or connect a camera to a live video variable, see the following sections in this article. Whenever you update a variable with new information, the graphic layer starts rendering and displays the change when it is fully rendered.
## Show All Variables
A slider labeled **Show All Variables** sits above the variables list. The slider has two states:
* **On** (the default) — every variable the graphic defines is listed, including the design-only ones the original template marked as non-dynamic.
* **Off** — only variables marked **Dynamic** in the original template appear. Static template variables are hidden from the list.
Switch the slider off when a graphic exposes more variables than you want to see during a show, and only the dynamic ones matter to the operator. Switch it on when you need to override a value the template designer did not mark dynamic.
The slider’s state is per-layer for the current session. Each new project or layer starts with the slider on.
{% hint style="info" %}
A variable’s **Dynamic** flag also gates whether Data Controllers can drive it. If a data feed should be updating a variable but is not, check that the variable is marked Dynamic in the [Designer](/design-and-customize-graphics/chapter-index-1.md). Switching the slider off in this tab hides the same non-dynamic variables that Data Controllers ignore.
{% endhint %}
## List of variables
* [Text](#text)
* [Colors](#colors)
* [Gradients](#gradients)
* [Images and pre-recorded videos](#images-and-pre-recorded-videos)
* [Media files](#media-files)
* [Live videos](#live-videos)
* [Data graphs](#data-graphs)
### Text
Enter new text in a text field, such as **Name** or **Subtitle**, then press **TAB** or **ENTER** to update the graphic.
### Colors
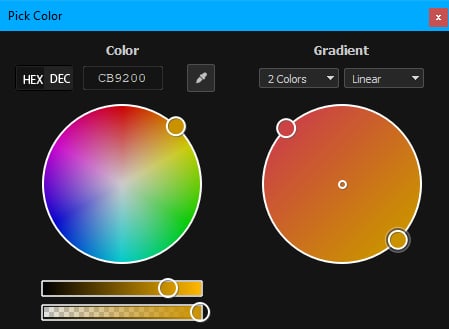
Click a color swatch and complete any of the following steps to select a color in the Pick Color dialog:
* Click a color on the wheel.
* Click **Hex** or **Dec**, then enter the desired Hex or Dec values.
* Click the color picker , then click a color on your screen. (Press ESC to cancel the color picker.)
* Click and drag the horizontal sliders to adjust the selected color’s hue and opacity.
### Gradients
Use the Gradient style to customize design layers with gradients based on multiple colors.
1. Click the color swatch.
2. In the Color section of the Pick Color dialog, complete any of the following steps to select a color:
* Click a color on the wheel.
* Click **Hex** or **Dec**, then enter the desired Hex or Dec values.
* Click the color picker , then click a color on your screen. (Press ESC to cancel the color picker.)
* Click and drag the horizontal sliders to adjust the selected color’s hue and opacity.
3. In the Gradient section, select the number of colors to include in the gradient and the type of gradient from the two drop-down lists.
4. In the gradient color wheel, click and drag each large circle to adjust the gradient’s color range, then click and drag the small circles to adjust the transition point between colors.
### Images and pre-recorded videos
To replace a default image or video, click an image or video thumbnail, then locate and select a new image or video.
To customize how an image or video fits within the available space for that design layer, select one of the following fit modes from the drop-down list next to an image or video variable.
**Fill**: The image or video fills all of the available space in the bounding box’s dimensions while maintaining its proportions.
**Fit**: The image or video fits inside the object’s bounding box without cropping and retains its aspect ratio, which means the image may not fill the entire variable area.
**Stretch**: The entire image or video resizes to fit in the entire variable area, but may not maintain its aspect ratio.
### Media files
A **Media File** variable maps a video, animated GIF, animated WebP, or still image onto its design layer — the file loops while the graphic is on air and starts from its beginning each time the graphic is taken. In the Live Values list it shows a thumbnail, a **Choose File** button, and a clear (trash) button.
Clicking **Choose File** opens the **Choose Media** picker, which lists video files first. You can also click the media region in the preview monitor — hover it and a browse button appears at its top-right, the same as for image variables.
The variable’s value is a plain file path, so a data source or the API can switch the media by sending a new path; the on-air layer changes files immediately, starting from the beginning. See [Create variables in graphics](/design-and-customize-graphics/chapter-index-4/create-variables-in-graphics.md) for authoring one.
### Live videos
You can stream video from a webcam or NDI-enabled camera.
1. Connect a webcam or NDI-enabled camera to your computer.
2. Select a video source from the video drop-down list on the left.
3. To customize the appearance of the live video, select an effect from the drop-down list in the middle, and then select one of the effect presets from the drop-down list on the right.
{% hint style="info" %}
If the design layer’s dimensions don’t match the aspect ratio of the video source, the live video will be resized to fit within the design layer, which may distort the video. If necessary, resize the design layer in the Designer.
{% endhint %}
### Data graphs
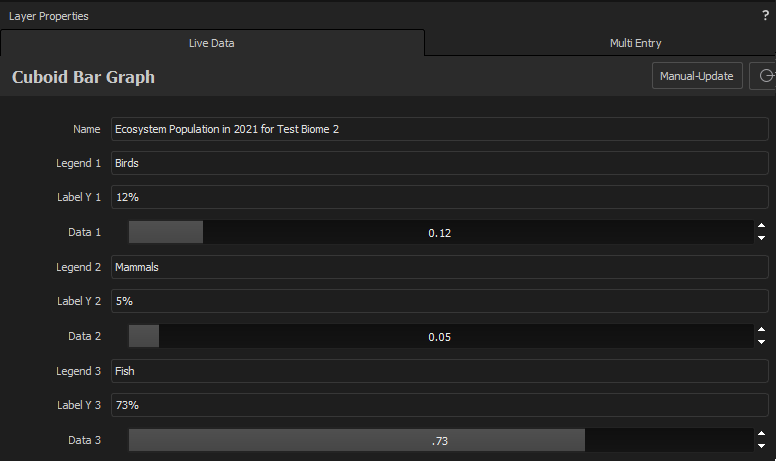
Use data graph variables with text or shape objects to show a percentage or quantity that changes dynamically based on incoming data.
To update the value of a data graph variable, double-click the value and enter a number between 1 and 100, which will be represented as a percentage.
**💡 TIP**\
You can automatically drive data from Facebook comment polls and reaction polls to data graph variables.
---
# Agent Instructions
This documentation is published with GitBook. GitBook is the documentation platform designed so that both humans and AI agents can read, navigate, and reason over technical content effectively. Learn more at gitbook.com.
## Querying This Documentation
If you need additional information that is not directly available in this page, you can query the documentation dynamically by asking a question.
Perform an HTTP GET request on the current page URL with the `ask` query parameter, and the optional `goal` query parameter:
```
GET https://captivatehelp.newbluelive.com/control-your-show/chapter-index/live-data-tab.md?ask=&goal=
```
`ask` is the immediate question: it should be specific, self-contained, and written in natural language.
`goal` is optional and describes the broader end goal you are ultimately trying to accomplish on behalf of the user. GitBook uses it to tailor the answer towards what is most useful for that goal.
The response will contain a direct answer to the question and relevant excerpts and sources from the documentation.
Use this mechanism when the answer is not explicitly present in the current page, you need clarification or additional context, or you want to retrieve related documentation sections.