> For the complete documentation index, see [llms.txt](https://captivatehelp.newbluelive.com/llms.txt). Markdown versions of documentation pages are available by appending `.md` to page URLs; this page is available as [Markdown](https://captivatehelp.newbluelive.com/control-your-show/chapter-index/cue-and-take-graphics.md).
# Play graphic layers in a specific sequence
Sequencing is a powerful feature that lets you play graphic layers in a specific order.
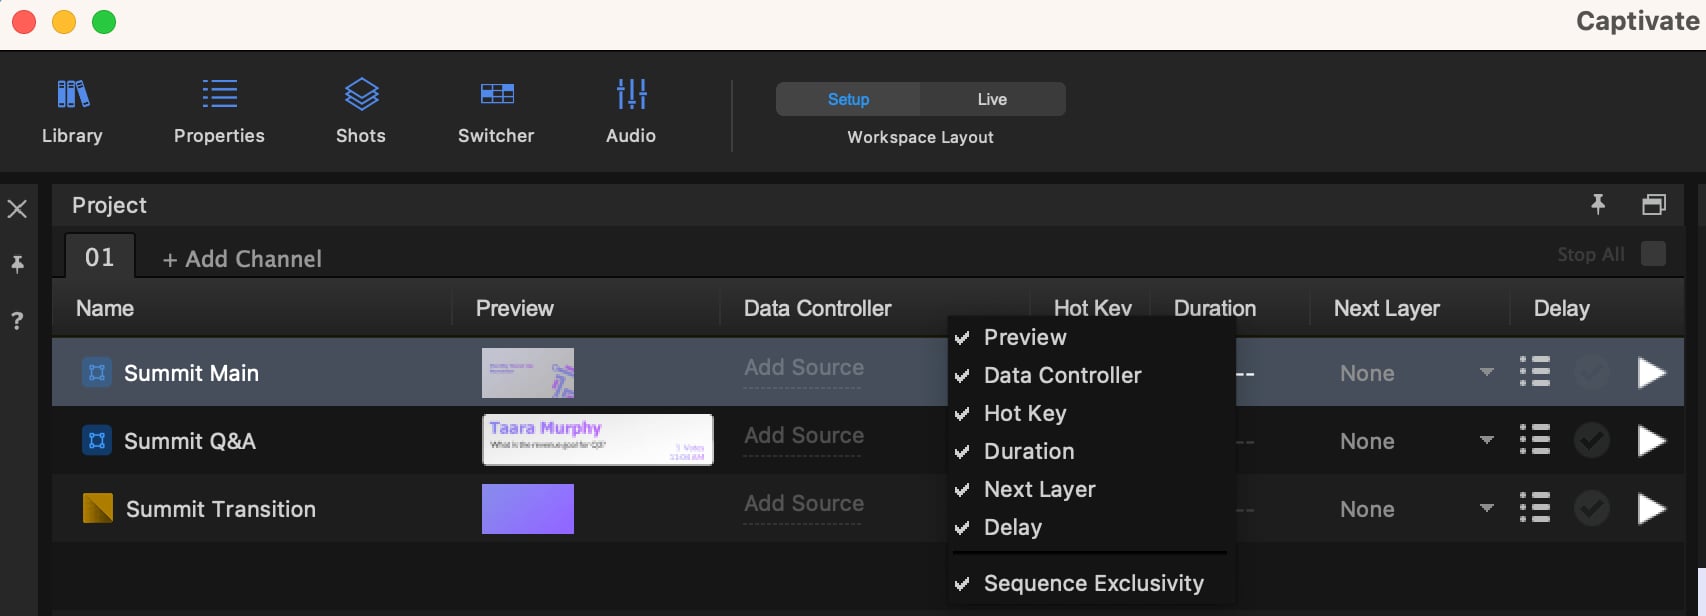
1. Right-click anywhere on the row of column labels to add the Duration, Next Layer, and Delay columns to your Project List.
2. Set up a new channel and populate it with graphic layers.
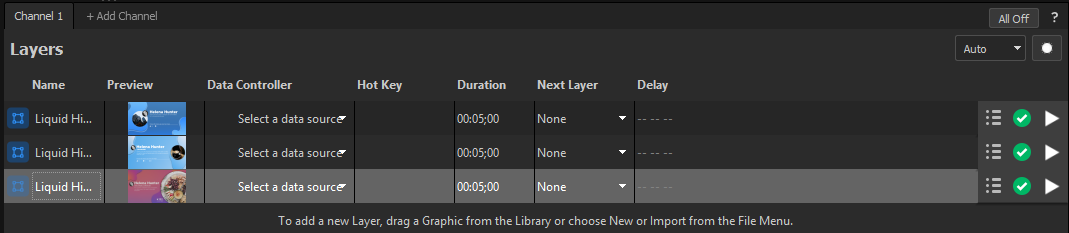
3. Make sure the layers you desire to use for your sequence have a customized duration. Graphic layers will have a no-limit duration by default. This is denoted by `-- -- --` in the **Duration** column for that graphic layer. Double-click the cell that corresponds to the layer to enter a custom duration (minutes:seconds;frames). When a custom duration has been set for a graphic layer, the **Next Layer** cell for that graphic will become available.
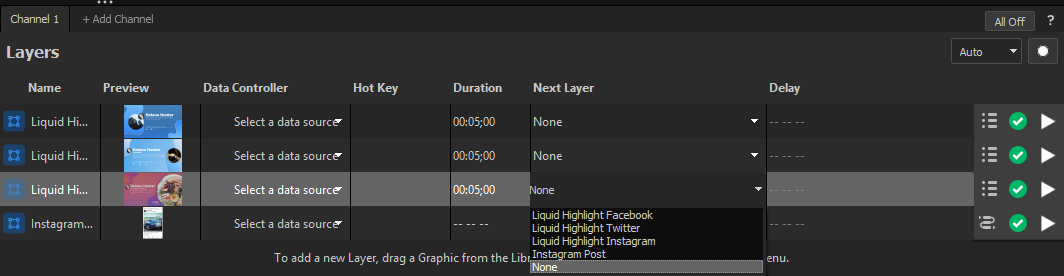
4. Use the **Next Layer** dropdown menu to select which graphic layer from that channel will play next.
5. If you assign a graphic layer to play next on itself, it will initiate a loop sequence and the graphic layer will play indefinitely until you play it out.
## Cue and take from the live-status column
Each row in the Project List has a live-status icon at the right edge. What a click on that icon does depends on Auto-live mode in the scheduler.
* **Auto-live ON**: a plain click runs the current playout command on the row. Off-air rows go on-air (Take); on-air rows come off (Take Off).
* **Auto-live OFF (cue/take)**: a plain click toggles the row’s Next state — clicking once cues the row, clicking again uncues it. Fire the cued row by double-clicking the icon, pressing Spacebar with the row selected (which runs Auto on that row), or using a Take action.
Modifier-click is constant regardless of Auto-live state:
* **Shift + click**: Take.
* **Ctrl + click**: Auto.
* **Alt + click**: Auto-in.
The live-status icon turns red when the row goes on-air, but it remains a play arrow — not a stop icon. Clicking the red icon runs the next playout command (typically Take Off) for that row.
In cue/take mode, the live-status icon uses a four-state dot palette instead of a play arrow:
* Grey dot: not cued, not on-air.
* Yellow dot: cued (Next).
* Red dot: on-air.
* Purple dot: on-air with a Next already set.
The dot palette has no in-app legend — operators new to cue/take mode may not recognize the colors at first.
## Per-variable columns on the Project List
When a layer has Dynamic variables, the Project List can show one column per variable with the current value at a glance. Right-click a column header to toggle these per-variable columns on or off. The values are read-only in the column — to change a value, use the **Live Values** tab in the Properties dock (see [Update variables in live graphic layers](/control-your-show/chapter-index/live-data-tab.md)).
Do not confuse the per-variable columns with the **Data Controller** column, which shows which Data Controllers are bound to each row, not the variable values themselves.
Per-variable columns refresh about once a second — useful as a quick read-out for operators monitoring several rows at once.
## Double-click the Preview column to edit the graphic
Double-clicking the **Preview** thumbnail in a row opens the [Designer](/design-and-customize-graphics/chapter-index-1.md) on that layer. This is the row equivalent of clicking the **Edit Graphic** button in the [Preview panel](/get-started/chapter-index-2/preview-panel.md).
The shortcut only works when your license includes the Designer. Without the Designer, double-clicking the Preview column has no effect.
---
# Agent Instructions
This documentation is published with GitBook. GitBook is the documentation platform designed so that both humans and AI agents can read, navigate, and reason over technical content effectively. Learn more at gitbook.com.
## Querying This Documentation
If you need additional information that is not directly available in this page, you can query the documentation dynamically by asking a question.
Perform an HTTP GET request on the current page URL with the `ask` query parameter, and the optional `goal` query parameter:
```
GET https://captivatehelp.newbluelive.com/control-your-show/chapter-index/cue-and-take-graphics.md?ask=&goal=
```
`ask` is the immediate question: it should be specific, self-contained, and written in natural language.
`goal` is optional and describes the broader end goal you are ultimately trying to accomplish on behalf of the user. GitBook uses it to tailor the answer towards what is most useful for that goal.
The response will contain a direct answer to the question and relevant excerpts and sources from the documentation.
Use this mechanism when the answer is not explicitly present in the current page, you need clarification or additional context, or you want to retrieve related documentation sections.